The WordPress plugin statistics in this analysis come from a complete snapshot of WordPress.org, every public detail on 63,418 plugins and 8,168 themes, cross-referenced against the live platform stats WordPress core phones home with every update check. I spent three days running the numbers, and the picture that came back was weirder and more concentrated than I expected.
The story everyone tells about WordPress is that it’s an open platform, a commons where any developer with a text editor and enough ambition can publish a plugin and compete. That story is mostly true and substantially misleading at the same time. There’s a category that’s 73% owned by one plugin. There’s a tag where 97.6% of the install share belongs to one plugin family, the closest thing to a perfect monopoly anywhere on the platform. And then there’s the AI surge: a single year of new plugin submissions that almost certainly explains why 2025 broke every record in the repo’s history. Eight sections of WordPress plugin statistics below, then methodology, then every chart.
1. The 2025 AI plugin surge
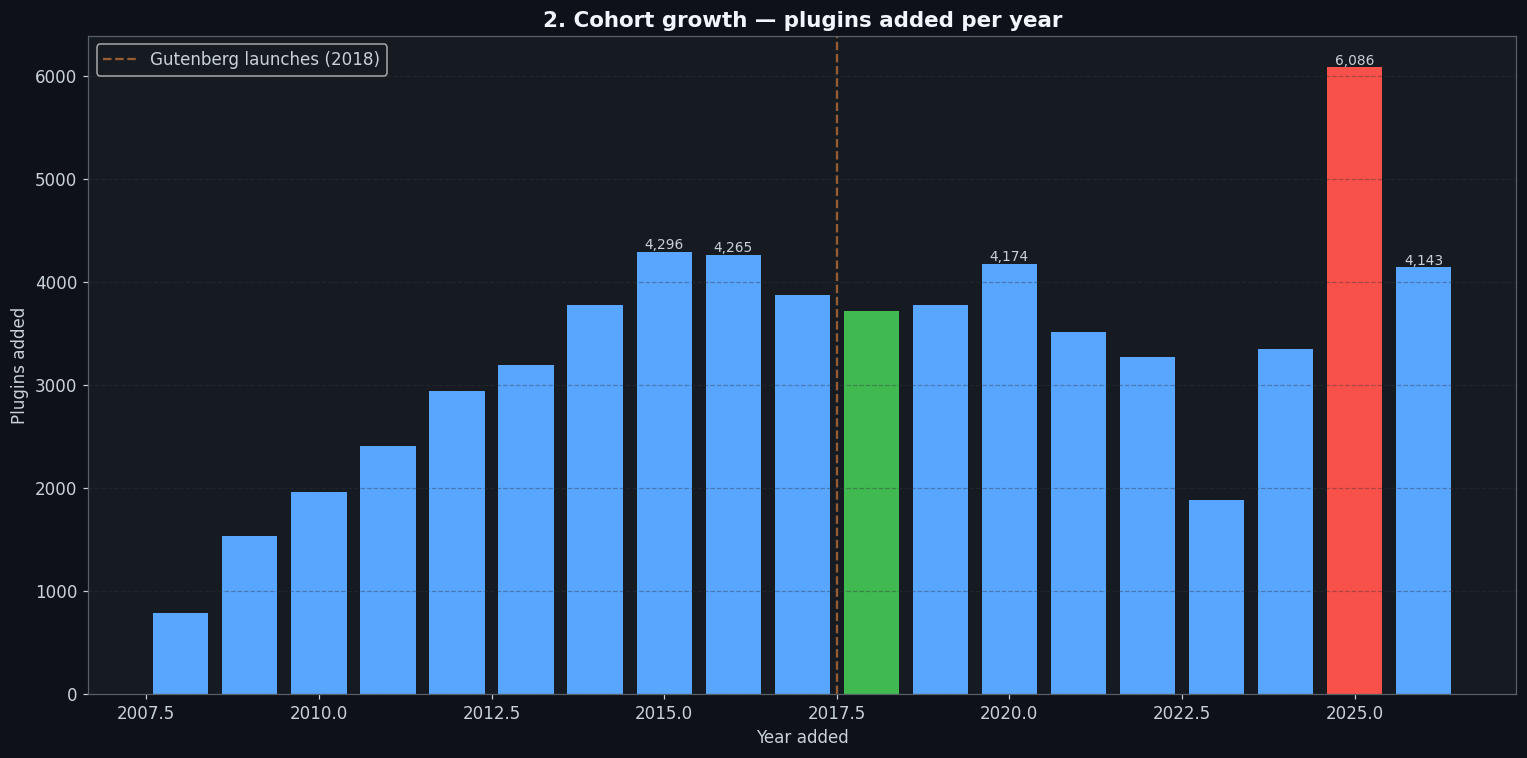
For most of the 2010s, WordPress.org absorbed somewhere between 3,000 and 4,500 new plugins per year. The slope was flat, a gentle plateau from around 2014 through 2016, then a slight dip after Gutenberg launched in late 2018. Nothing dramatic. Year-over-year variation was noise, not signal. The platform felt mature in the way a highway feels mature: traffic moves, lanes are full, nothing is expanding. Then 2023 happened, only 1,885 new plugins for the entire year, the lowest count in more than a decade. The sort of thing that prompts “is WordPress dying?” takes on Hacker News.
Then 2025 happened. 6,086 new plugins added, an all-time record, more than 3× the 2023 trough and roughly 45% above any previous year on record. And 2026 is already on pace to lap it: 4,143 new plugins in the first five months alone, which annualizes to somewhere around 10,000 new entries by December. I had to double-check this number twice, because the slope on the cohort chart looks like someone flipped a switch. The 2023-to-2025 reversal, from all-time low to all-time high in two years, is the sharpest inflection point in these WordPress plugin statistics by a wide margin, and the timing aligns closely with the broad availability of AI coding tools.
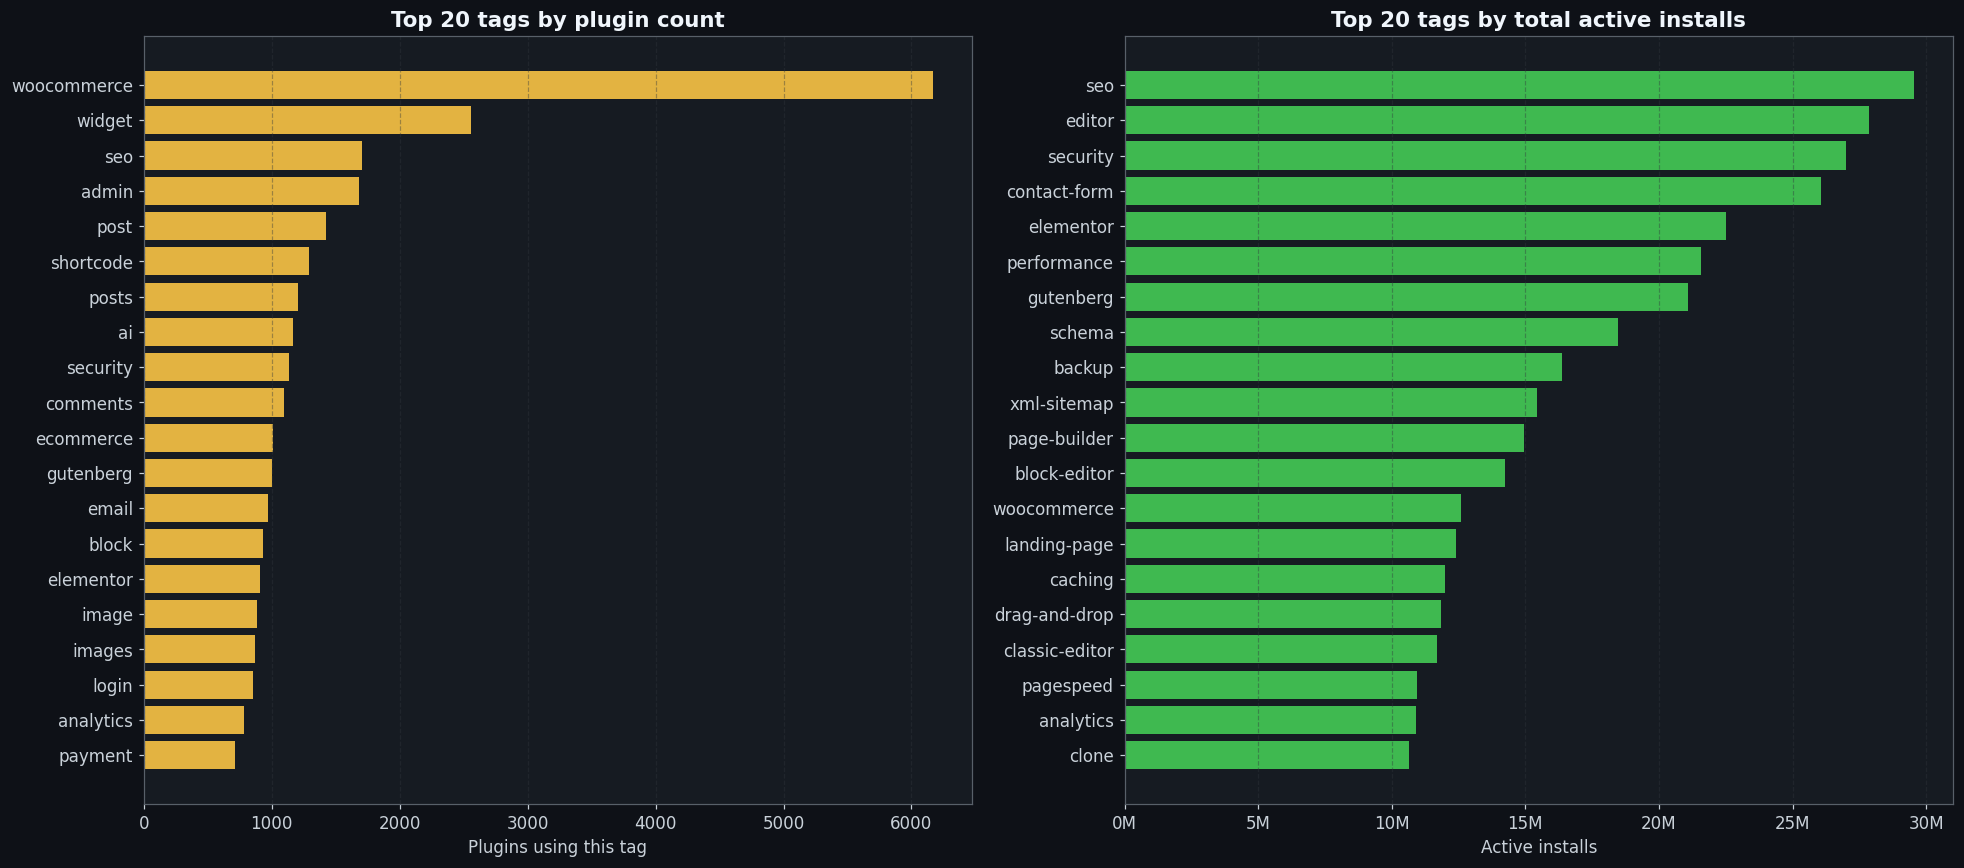
What happened? The most likely explanation is that AI has reshaped both what plugins are being built for and how fast they can be built. 1,167 plugins currently self-tag as ai, the eighth-most-common tag across 63,418 plugins, sitting just behind security and comments. The tag didn’t exist in any meaningful volume a few years ago. For context on how saturated that is: within the WooCommerce ecosystem specifically, 2.4% of plugins tag ai. In the SEO & Marketing category, ai is now the third-most-common tag after seo itself. That signals where developer attention is concentrating, a wave of plugins integrating with LLM APIs, AI assistants, content generation, and similar use cases. It doesn’t directly prove the surge is AI-authored, but the timing of the 2023 to 2025 inflection coincides closely with broad availability of code-generation tools, and the volume is hard to explain otherwise.
Whether the 2025 surge represents a wave of genuinely useful tools or a flood of AI-generated boilerplate is the question the next 12 months will answer. Rating trajectories on the 2025 cohort over the 90-day mark will be the tell, good plugins accumulate reviews; junk accumulates nothing or gets closed. If the submission volume keeps climbing toward 10,000 entries for 2026 and the quality signals don’t follow, the WordPress.org review team is going to have a very difficult few years.
Worth watching: the 2025 cohort’s average install count at the 12-month mark versus the 2022 and 2023 cohorts at the same age. If the 2025 batch plateaus near zero, the repo got flooded with essentially inert submissions. If it converges toward historical norms, the AI-assisted submissions are at least being useful to someone.
2. The hidden monopolies (not where you’d guess)
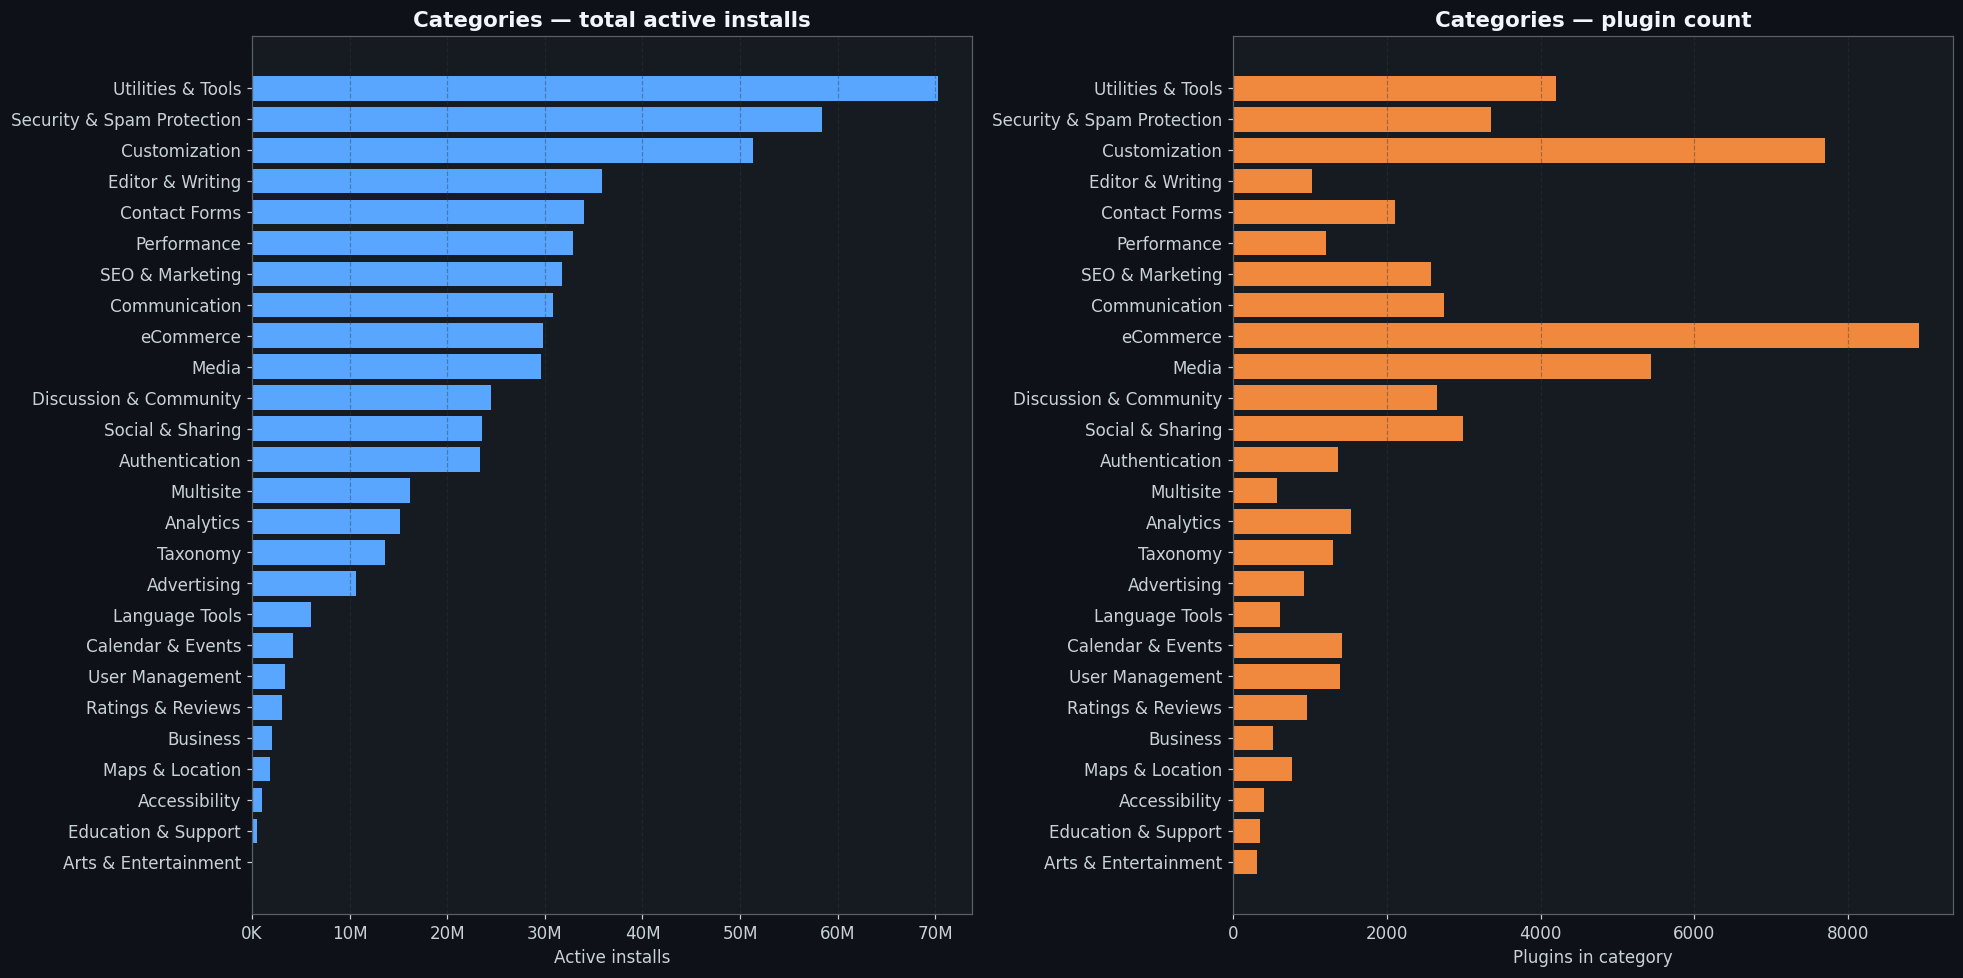
If you asked me before pulling these WordPress plugin statistics which WordPress plugin category was the most monopolized, I’d have guessed eCommerce, WooCommerce is everywhere, or maybe SEO. I was wrong on both. The Herfindahl-Hirschman Index (HHI) tells a different story entirely, and it’s a stranger one.
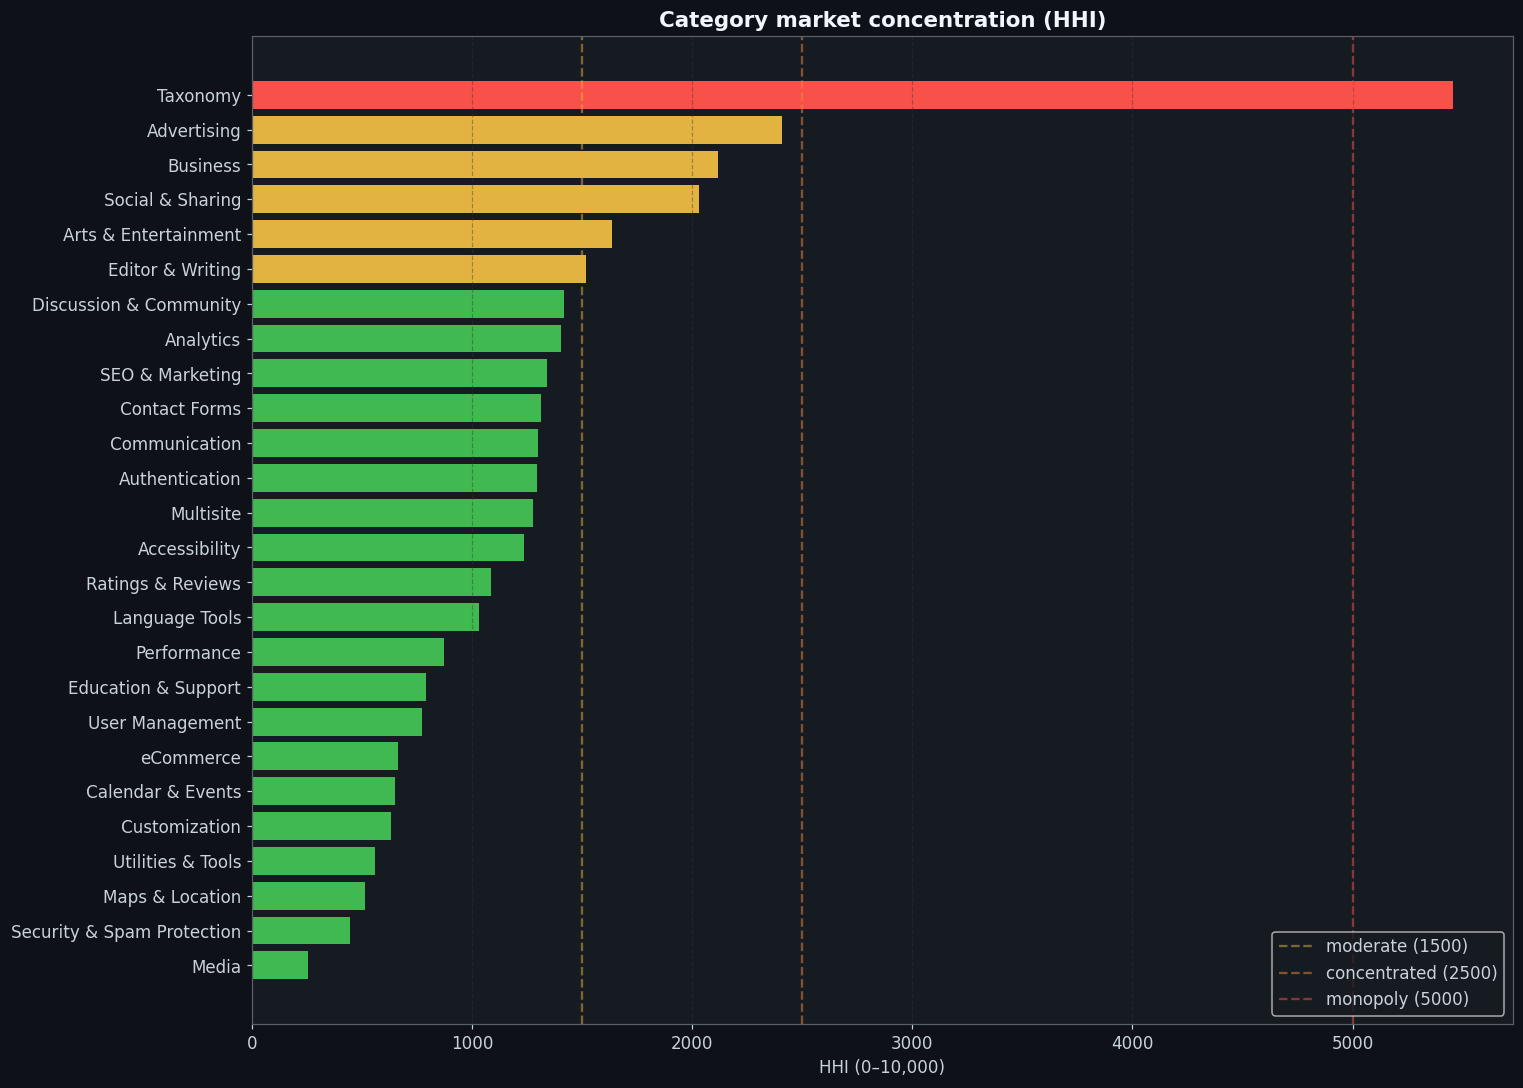
For reference: HHI runs from 0 to 10,000. Below 1,500 means a fragmented, competitive market. Between 1,500 and 2,500 is moderate concentration. Above 2,500 is concentrated. Above 5,000 is the monopoly threshold, one player so dominant that market dynamics have essentially stopped functioning. A perfectly competitive market with infinitely many equal-sized players has an HHI approaching zero; a perfect monopoly where a single player holds 100% share has an HHI of exactly 10,000. Across all 29 WordPress plugin categories with more than 5 plugins, only one crosses the monopoly threshold:
| HHI | Category | Dominant player | Install share |
|---|---|---|---|
| 5,455 | Taxonomy | wordpress-seo (Yoast SEO) | 73.4% |
| 2,408 | Advertising | google-site-kit | 46.9% |
| 2,117 | Business | wp-reviews-plugin-for-google | 44.4% |
| 2,032 | Social & Sharing | wordpress-seo | 42.4% |
| 1,519 | Editor & Writing | elementor / classic-editor | 27.9% / 25.1% |
Taxonomy is the only monopolized category on the platform, and it’s monopolized by Yoast SEO, with an HHI of 5,455. Yoast holds 73.4% of installs in that category. This isn’t because Yoast is fundamentally a taxonomy tool, it’s because Yoast SEO is so massive that whichever auxiliary category it touches, its install weight dominates. The next-closest plugin in Taxonomy is custom-post-type-ui at 7.3%. That’s not a market; that’s one player and everyone else.
The Advertising and Business numbers have a different flavor: they’re Google-dominated in ways that have nothing to do with WordPress in particular. Google Site Kit accounts for 46.9% of installs in the Advertising category, every WordPress site that wants Google Analytics, Search Console, or AdSense integration in one place lands on that plugin almost by default. The Business category is concentrated around wp-reviews-plugin-for-google at 44.4%, which is essentially the same dynamic: Google’s review platform is dominant, so the plugin that connects to it is dominant.
The Editor & Writing number is the most interesting one, because it’s telling a platform story rather than a brand story. Elementor owns 27.9% of Editor & Writing installs. Classic Editor owns 25.1%. Together they account for more than half the category. Those two plugins are pulling in opposite directions, Elementor is the modern visual page-builder, Classic Editor is what you install when you want to opt out of Gutenberg’s block editor. Their near-equal install shares suggest the WordPress user base is roughly split between “embrace the new editor” and “give me what I had before 2018.”
At the other extreme, Media is the most competitive category on the platform: HHI 253, roughly 40 effective competitors, and no single plugin holding more than 10.1% of installs (that’s Jetpack, barely). If you’re looking for a plugin category where market position is still genuinely up for grabs, media plugins are it.
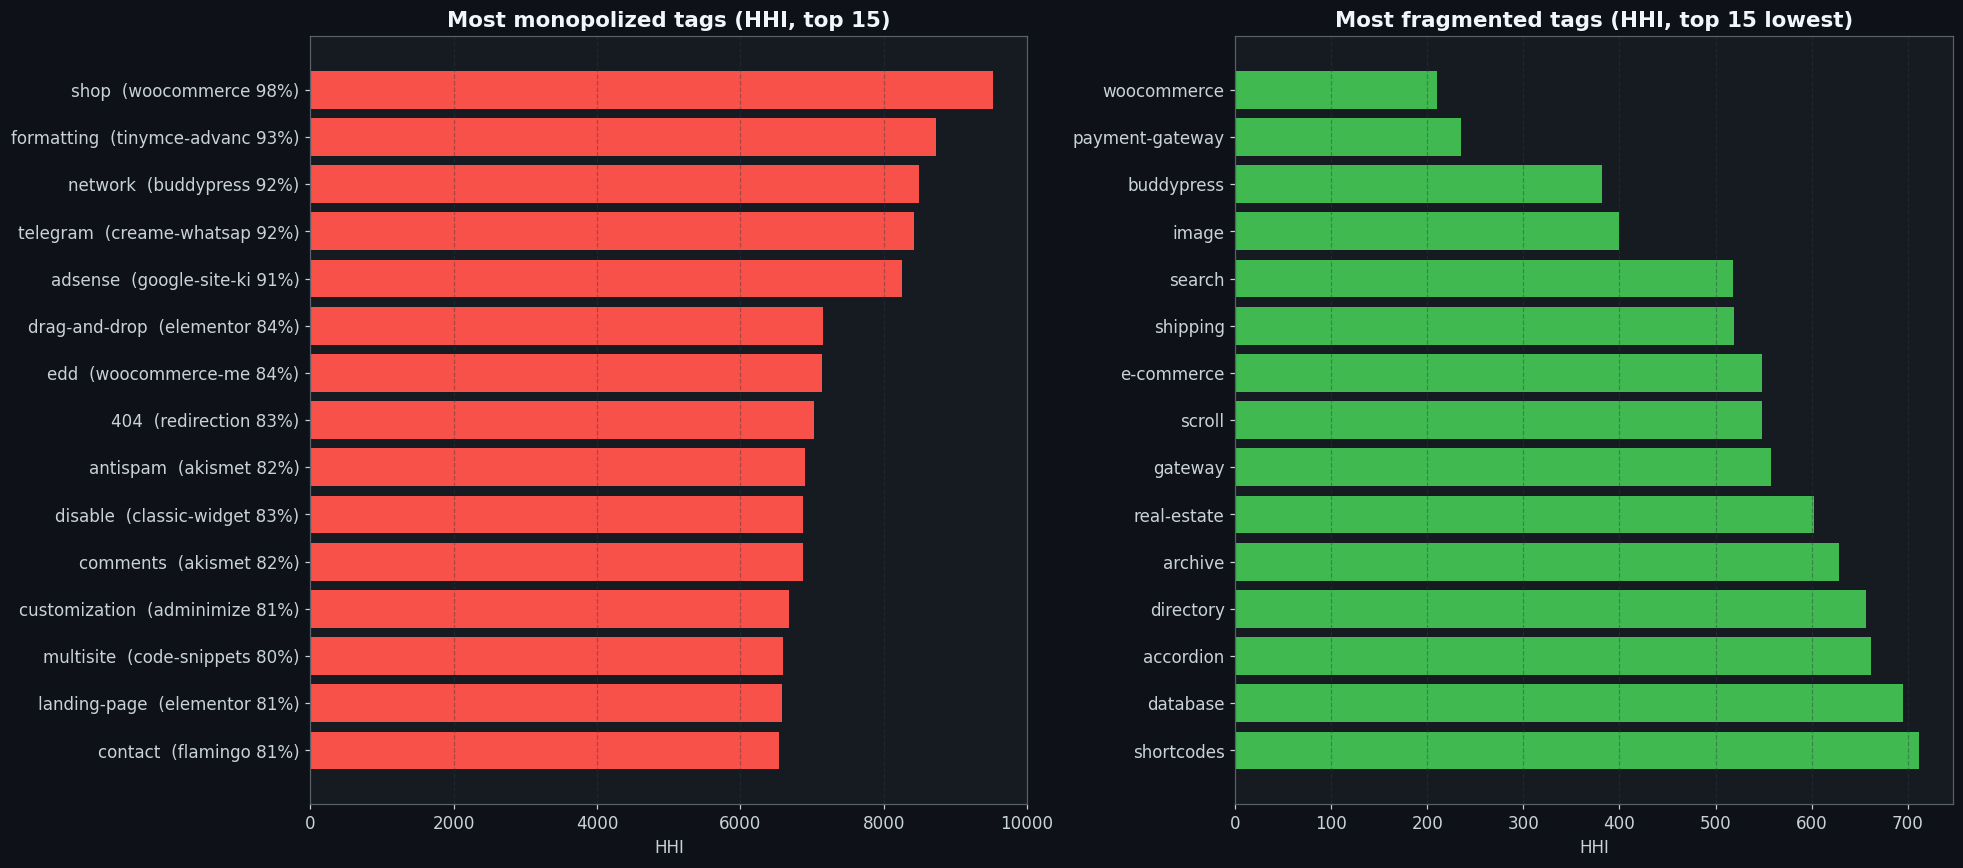
The tag-level concentration numbers are even starker than the category ones. At the category level, “monopolized” means 73% share. At the tag level, WooCommerce owns 97.6% of all installs that ever tagged a plugin with shop, an HHI of 9,530. That’s as close to a perfect monopoly as the HHI scale can express outside of a literally single-player market. Other thoroughly monopolized tags include formatting (TinyMCE Advanced at 93.4%), network (BuddyPress at 92.1%), and adsense (Google Site Kit at 90.7%).
These aren’t markets anymore, they’re vocabulary that one plugin owns so completely that anyone else using those tags is essentially riding on someone else’s brand equity without the install share to show for it. If you’re building something new and you tag it shop, you’re not competing in the shop market; you’re just confirming that WooCommerce exists. The flip side: the most fragmented tags on the platform, woocommerce itself (HHI 210, ~48 effective competitors, no player above 7.2%), payment-gateway, image, search, shipping, are the ones where showing up with a genuinely better product still translates to real install growth. The concentration map isn’t just an academic exercise; it’s useful input for a product strategy decision.
3. WooCommerce defines its ecosystem, doesn’t dominate it
In the WordPress plugin statistics, 6,166 plugins, exactly 10% of the entire WordPress.org catalog, tag themselves with woocommerce. That is a gravitational field, not a market. WooCommerce is the most-tagged term on the platform by a margin: the next-closest tag is widget at 2,558 plugins. WooCommerce has more than twice as many tagging plugins and laps the field. When one keyword describes a tenth of everything in a 63,000-item catalog, you’ve stopped describing a submarket and started describing an entire economic layer of the internet.
And yet, here is where it gets interesting, WooCommerce the plugin does not dominate WooCommerce the ecosystem. I ran the HHI calculation specifically on that woocommerce-tagged subset, and the result is 210. For reference: that’s the most fragmented submarket anywhere on the platform. No single plugin holds more than 7.2% of ecosystem installs. The effective competitor count is approximately 48. You have a tag that behaves like a perfect monopoly when measured from the outside, shop HHI 9,530, WooCommerce 97.6%, and a tag that is maximally competitive when measured from the inside. WooCommerce created the category. Within the category it created, it competes with everybody else.
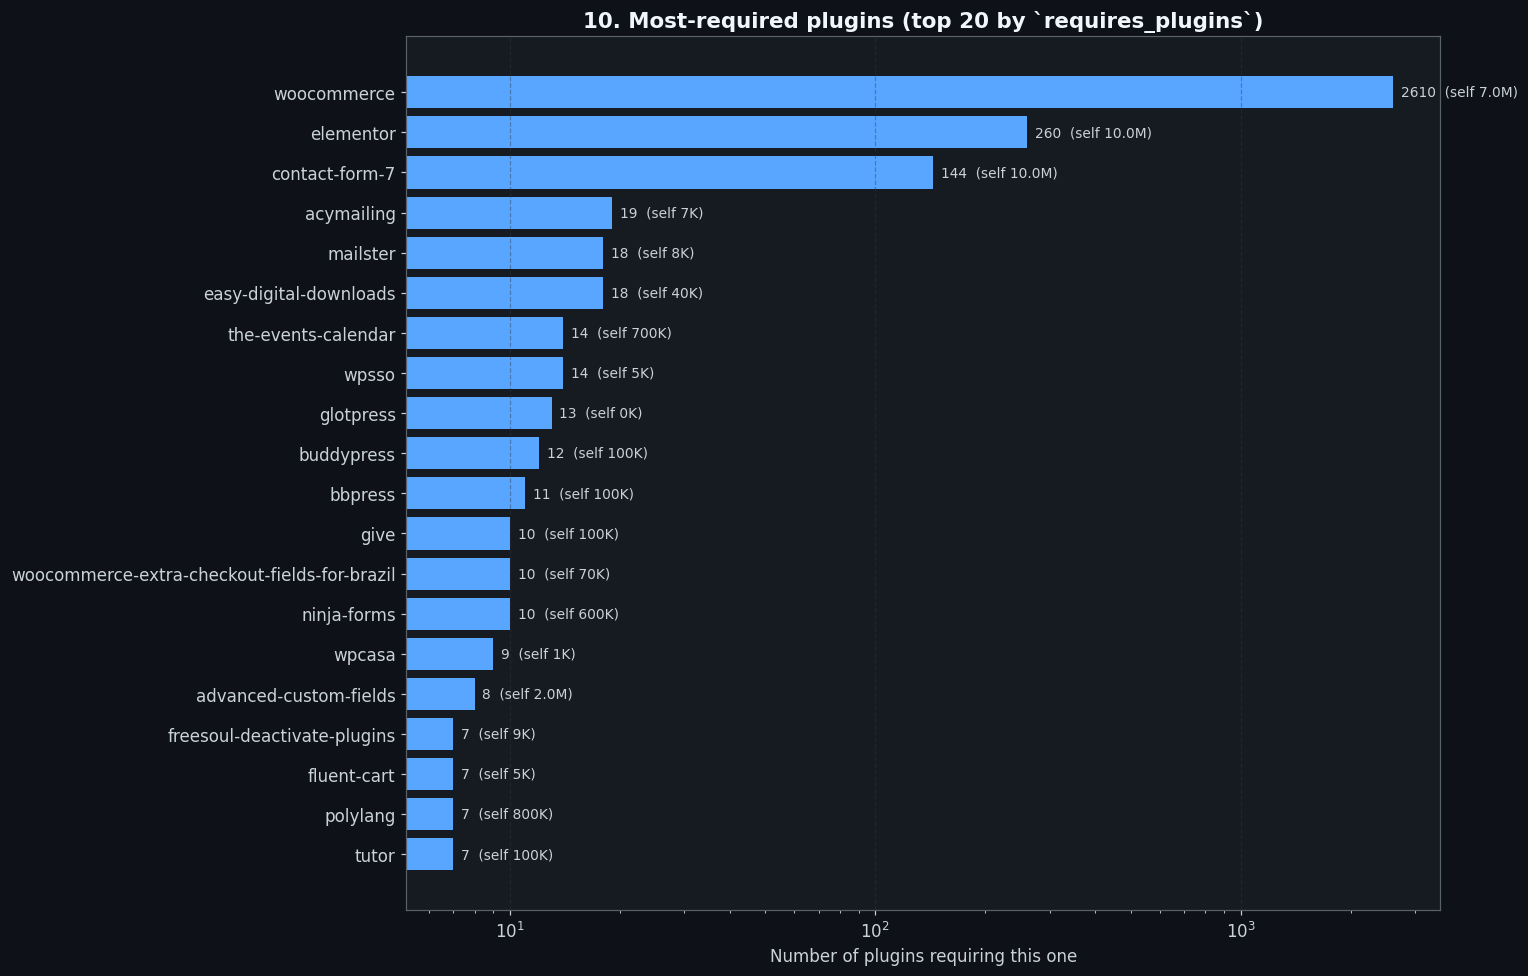
The dependency graph sharpens this further. 2,610 plugins explicitly declare WooCommerce as a requires_plugins dependency, the highest dependency count on the platform, by a margin of 10:1. The next most-required plugin is Elementor at 260 declared dependents. That gap is not a rounding error; it’s structural. WooCommerce has become the closest thing WordPress has to a platform-within-a-platform. Plugin developers don’t build plugins that work *alongside* WooCommerce the way they build plugins that work alongside Elementor. They build plugins that cannot exist without WooCommerce. That’s a different kind of dependency relationship.
The total ecosystem install count, 12.6 million installs across all woocommerce-tagged plugins, excluding WooCommerce core itself, sounds large until you divide by the plugin count. Mean installs per WC ecosystem plugin: 2,042. That is extremely long-tail. Most WooCommerce add-ons are niche, narrow, and serving a specific use case for a specific slice of the 7-million-strong WooCommerce install base. The distribution is exactly what you’d expect from a platform that attracts both serious commercial operators (payment gateways, shipping integrations) and individual developers solving one specific problem they encountered running their own shop.
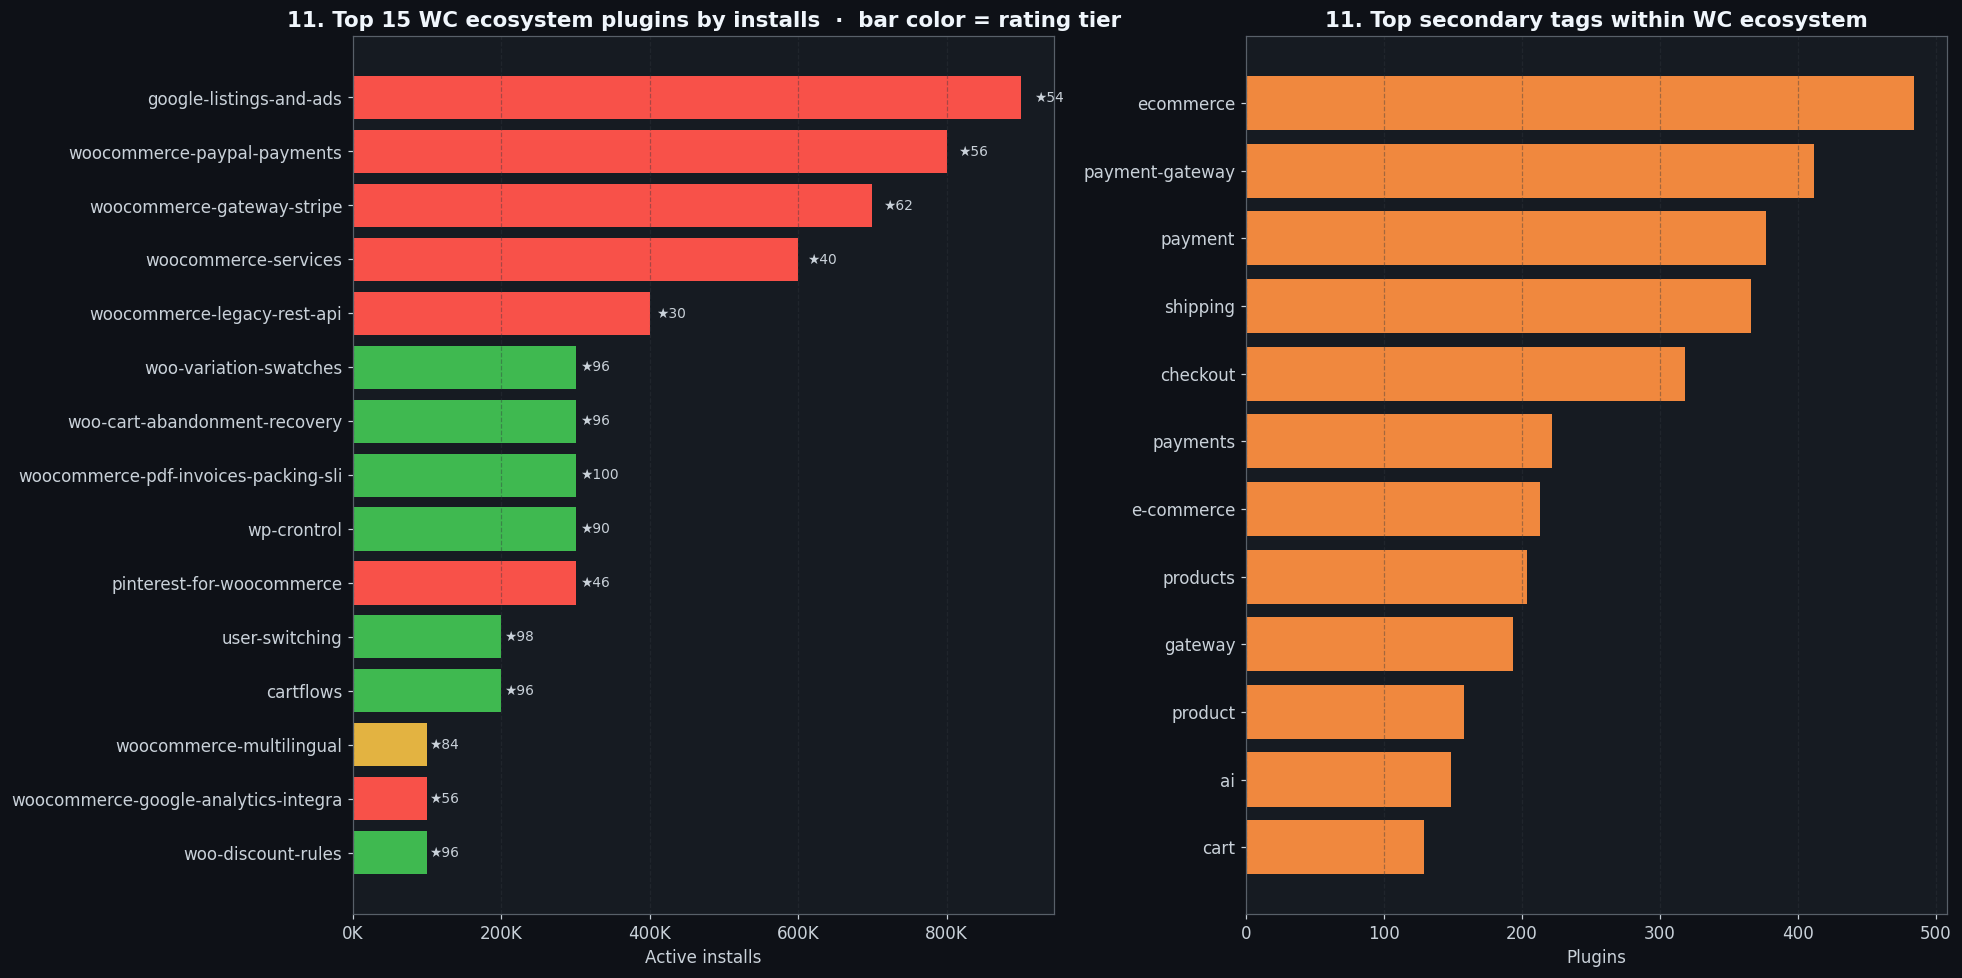
The quality split inside the ecosystem is genuinely striking, though. Here are the top WooCommerce ecosystem plugins by install count:
| Plugin | Installs | Rating |
|---|---|---|
google-listings-and-ads |
900K | 54 |
woocommerce-paypal-payments |
800K | 56 |
woocommerce-gateway-stripe |
700K | 62 |
woocommerce-services |
600K | 40 |
woocommerce-legacy-rest-api |
400K | 30 |
woo-variation-swatches |
300K | 96 |
woo-cart-abandonment-recovery |
300K | 96 |
woocommerce-pdf-invoices-packing-slips |
300K | 100 |
Automattic’s official WooCommerce auxiliary plugins, the ones bearing the woocommerce- prefix, shipped by the same company that built the core product, rate 40–62 out of 100. woocommerce-services scores 40. woocommerce-legacy-rest-api is at 30. The community-built alternatives slot in immediately behind them by install count and rate 96–100. woo-variation-swatches, woo-cart-abandonment-recovery, and woocommerce-pdf-invoices-packing-slips are all community work, all hitting near-perfect scores. The data says, bluntly: across the WordPress plugin statistics, the community has built better WooCommerce add-ons than WooCommerce’s owner has.
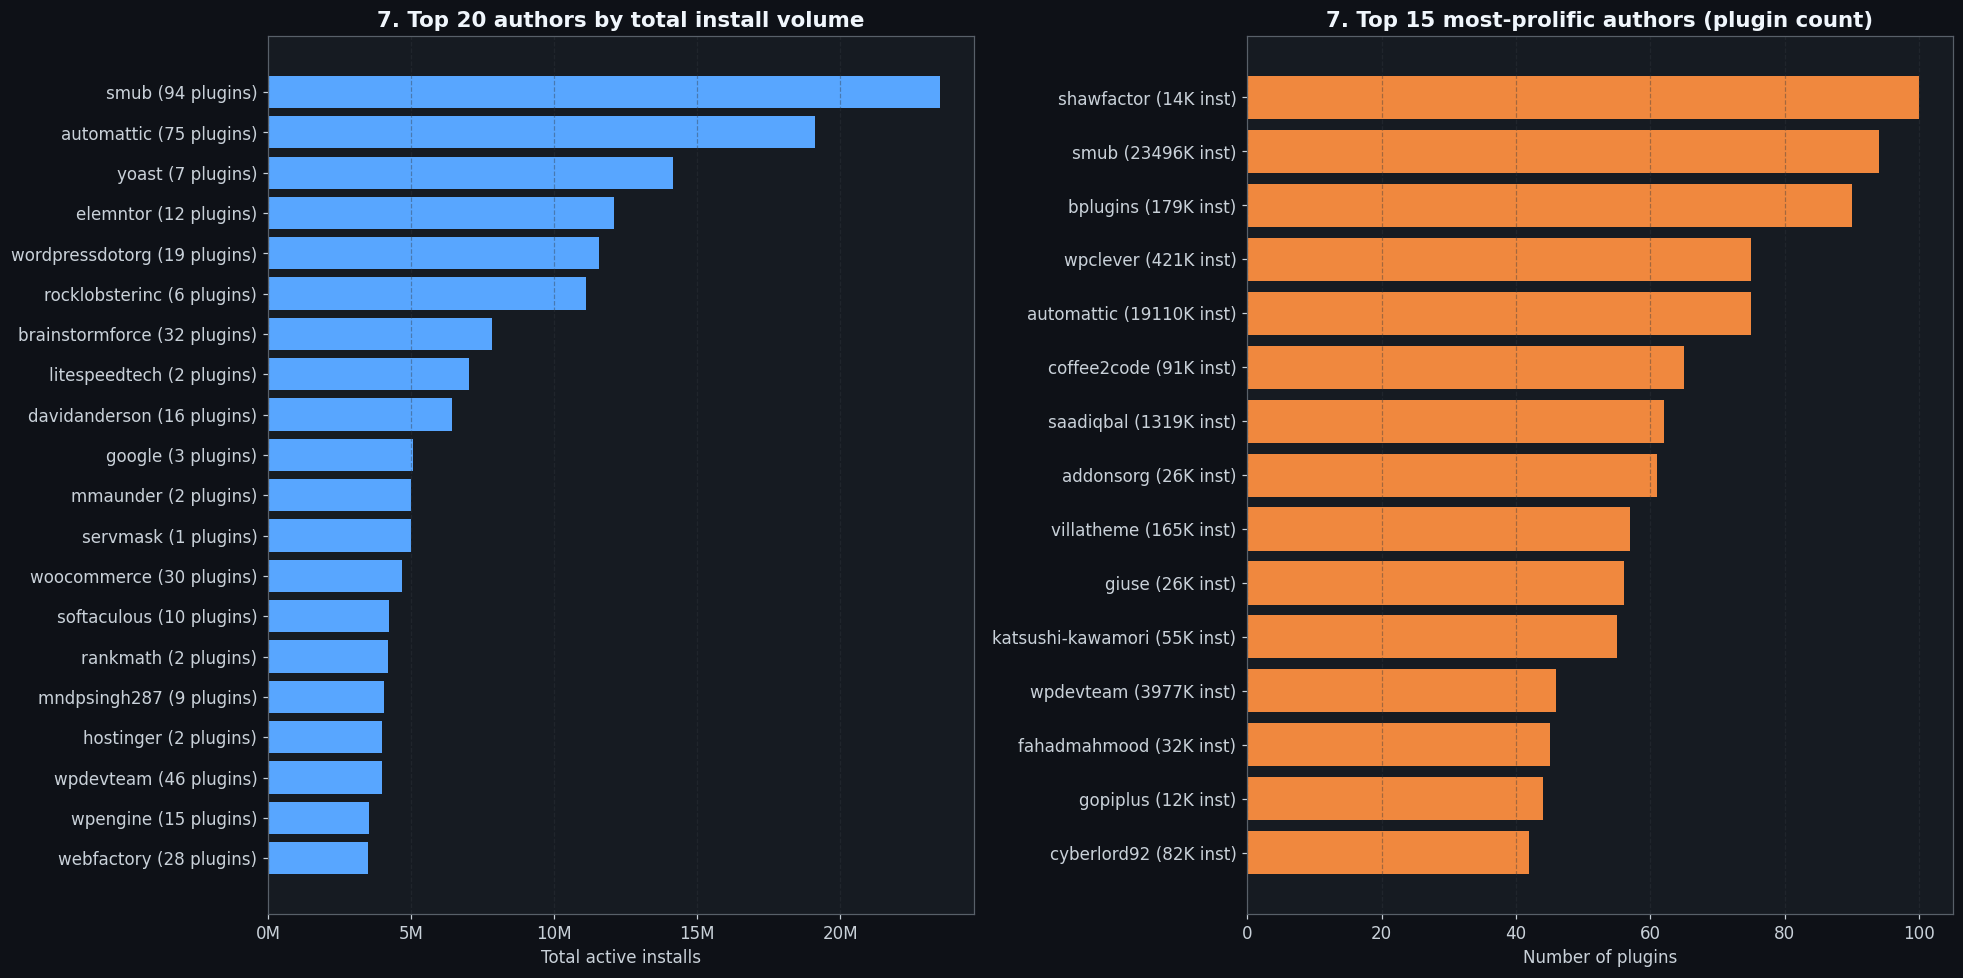
You can see this pattern echoed in the author-level analysis, the woocommerce author account averages a 55/100 rating across its portfolio, versus the 92–97 range for independent WC ecosystem developers. This isn’t a slight against Automattic’s engineering; it reflects the fact that mandatory integrations (payment processors, legacy REST API endpoints) attract critical users in a way that optional quality-of-life tools do not. But the gap is still there, and it’s visible in the data.
4. The PHP gap: declared floors vs real installs
The PHP-version slice of the WordPress plugin statistics has two sides, what plugin authors declare as their minimum requirement, and what WordPress users actually run. The gap between those two numbers is the most straightforward disconnect in this entire dataset.
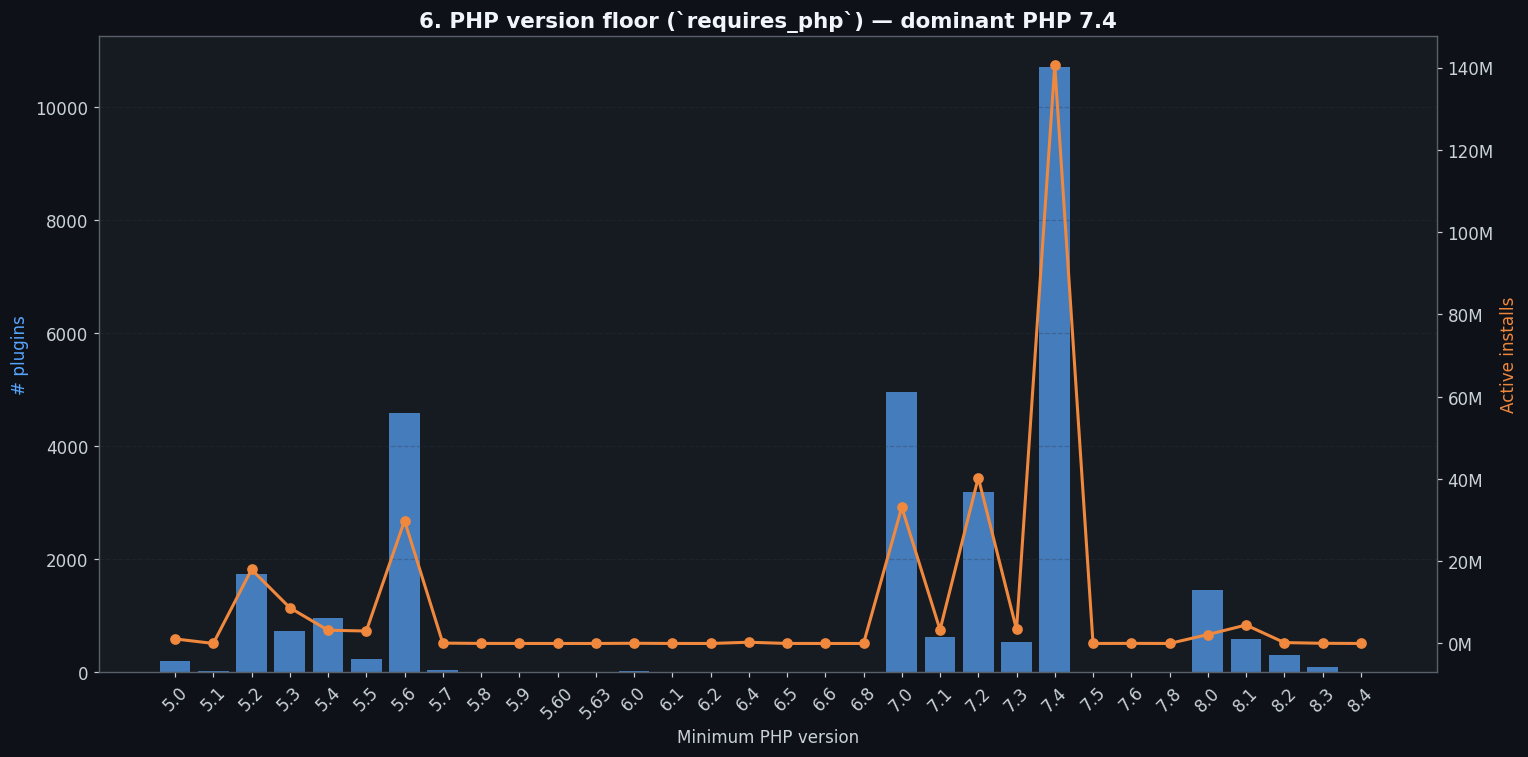
On the declaration side: 34.4% of plugins that declare a PHP floor set it at PHP 7.4. That’s the modal floor, more plugins target PHP 7.4 as their minimum than any other version. PHP 7.0 is second at 15.9%, PHP 5.6 is third at 14.7%. Almost nobody is declaring PHP 8.0+ as their floor. Worth noting: 50.9% of plugins don’t declare requires_php at all, which means the analysis of declared floors is based only on the 49% who bothered to specify. The non-declarers are presumably running whatever they were built on and hoping for the best.
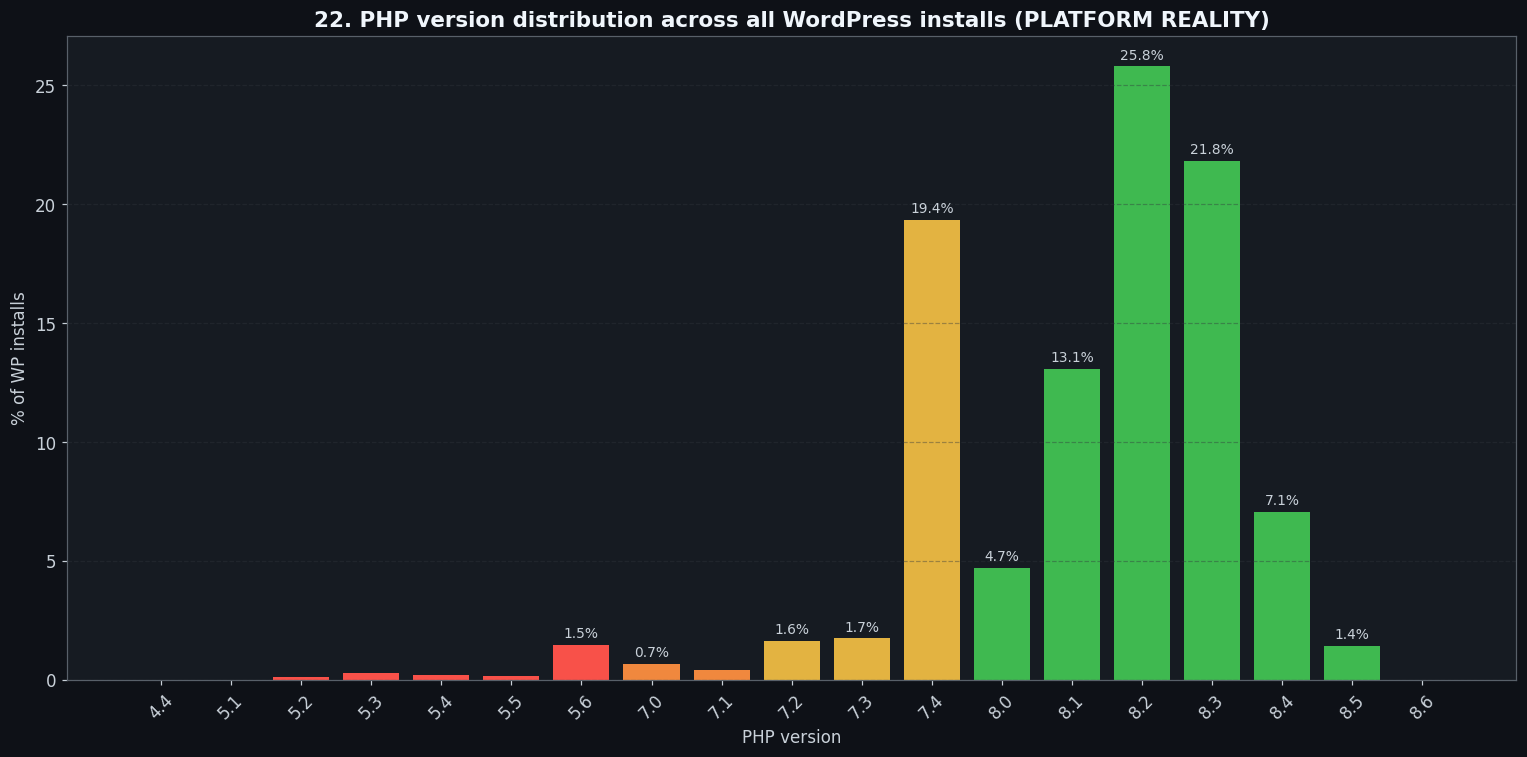
On the reality side, here is what PHP versions WordPress sites actually run, pulled from the same api.wordpress.org/stats/php/1.0/ endpoint that WordPress core pings at every update check:
| PHP version | Real share |
|---|---|
| PHP 8.2 | 25.80% |
| PHP 8.3 | 21.83% |
| PHP 7.4 | 19.35% |
| PHP 8.1 | 13.08% |
| PHP 8.4 | 7.06% |
| PHP 8.0 | 4.72% |
PHP 8.2 is the single most-common version on real WordPress installs, 25.80%, modal, the plurality winner. PHP 8.3 is second at 21.83%. PHP 7.4, the version that dominates plugin floor declarations, sits in third place at 19.35%. The cumulative picture: PHP 8.0 and above accounts for 73.91% of all real WordPress installs.
The honest read on this gap is more nuanced than “authors are behind.” A requires_php declaration is a floor, not a target, it tells WordPress not to install the plugin on anything below that version. Many authors deliberately set this floor low because PHP 7.4 still represents ~19% of real installs, and a higher floor would voluntarily exclude millions of users on shared hosting that can’t easily upgrade. That’s defensive: maximize the addressable user base, write code that’s safe on the floor version, test against the modern versions users actually run.
The data shows the gap but doesn’t tell us which group dominates: authors writing modern code and declaring conservative floors (fine), or authors who built on 7.4 years ago, never revisited, and whose code may quietly fail on the 73.91% of installs running 8.x (not fine). The 50.9% of plugins that don’t declare requires_php at all is a separate signal, that’s not conservatism, it’s just not bothering. The takeaway isn’t that the author cohort has fallen behind. It’s that “declared floor” is a much noisier signal than the WordPress.org tooling makes it look.
The PHP version distribution also has a notable shape: 8.2 and 8.3 together hold 47.63% of installs, versus PHP 7.4’s 19.35%. The PHP 8.x wave is now the dominant production reality, whether plugin authors are testing against it or not. PHP 8.0 through 8.4 tightened type handling in ways that legacy code can fail under, stricter type coercion for internal functions, stricter null handling, removal of long-deprecated features. Code that ran fine on PHP 7.4 can fail silently or loudly on the 73.91% of installs that have moved past it. Most of that risk is in old procedural code and legacy class structures that plugin authors never revisited after initial release, regardless of what their declared floor says.
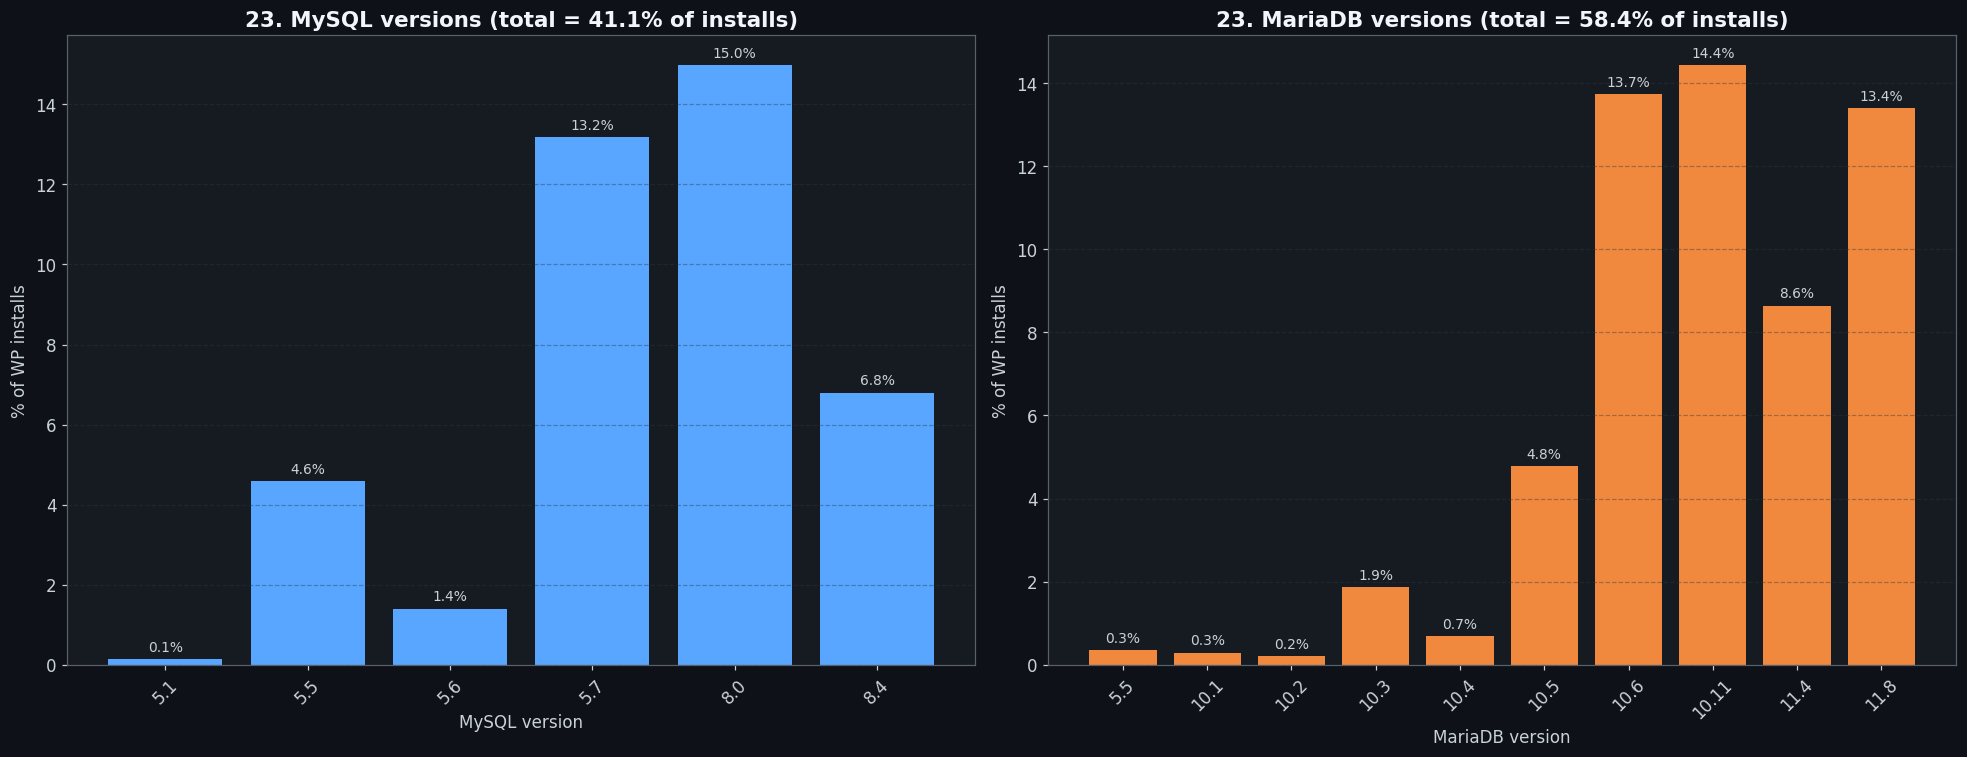
The database side of the platform story is equally surprising to people who haven’t followed hosting trends closely. MariaDB accounts for approximately 58% of WordPress database deployments (classified by parsing version strings from the /stats/mysql/1.0/ endpoint); MySQL holds the remaining 42%. The cPanel/shared-hosting industry standardized on MariaDB years ago, it’s the default database engine on most major shared hosts, and shared hosting is where most WordPress sites live. WordPress documentation still leads with “MySQL” and most plugin readme files mention MySQL without mentioning MariaDB. But MariaDB has quietly become the majority database engine in the WordPress hosting world.
For most workloads the compatibility is transparent, but edge cases around JSON functions, specific full-text search behaviors, and strict mode handling differ between the two. If you’re targeting WordPress developers with database-adjacent tooling, your testing matrix should weight MariaDB at 58%, not treat it as an afterthought to MySQL.
5. Solo dominates by count. Teams dominate by installs.
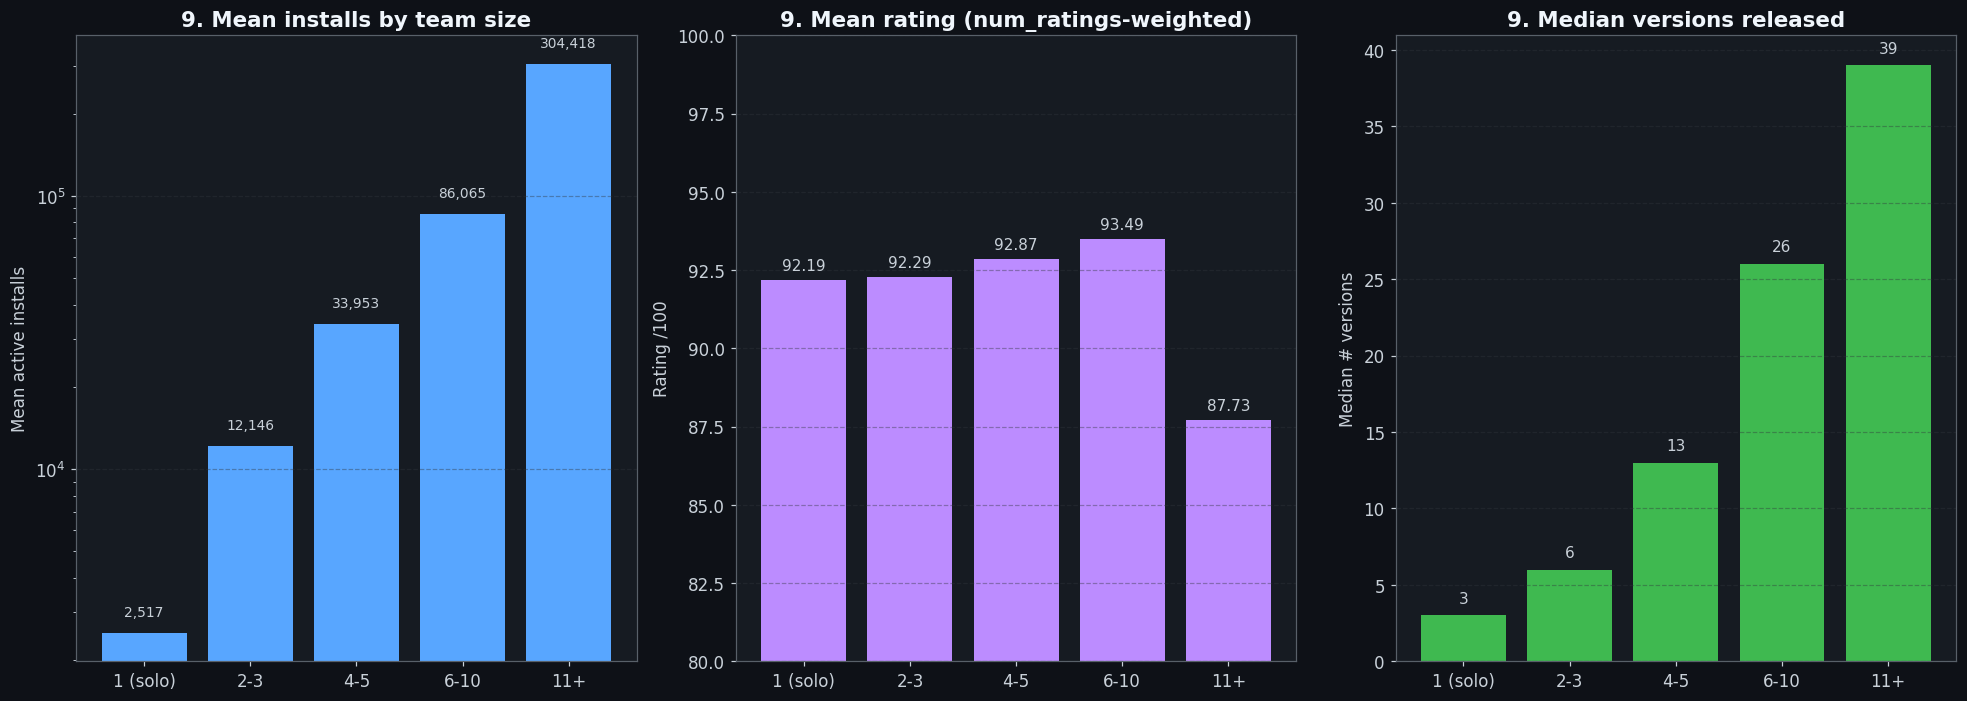
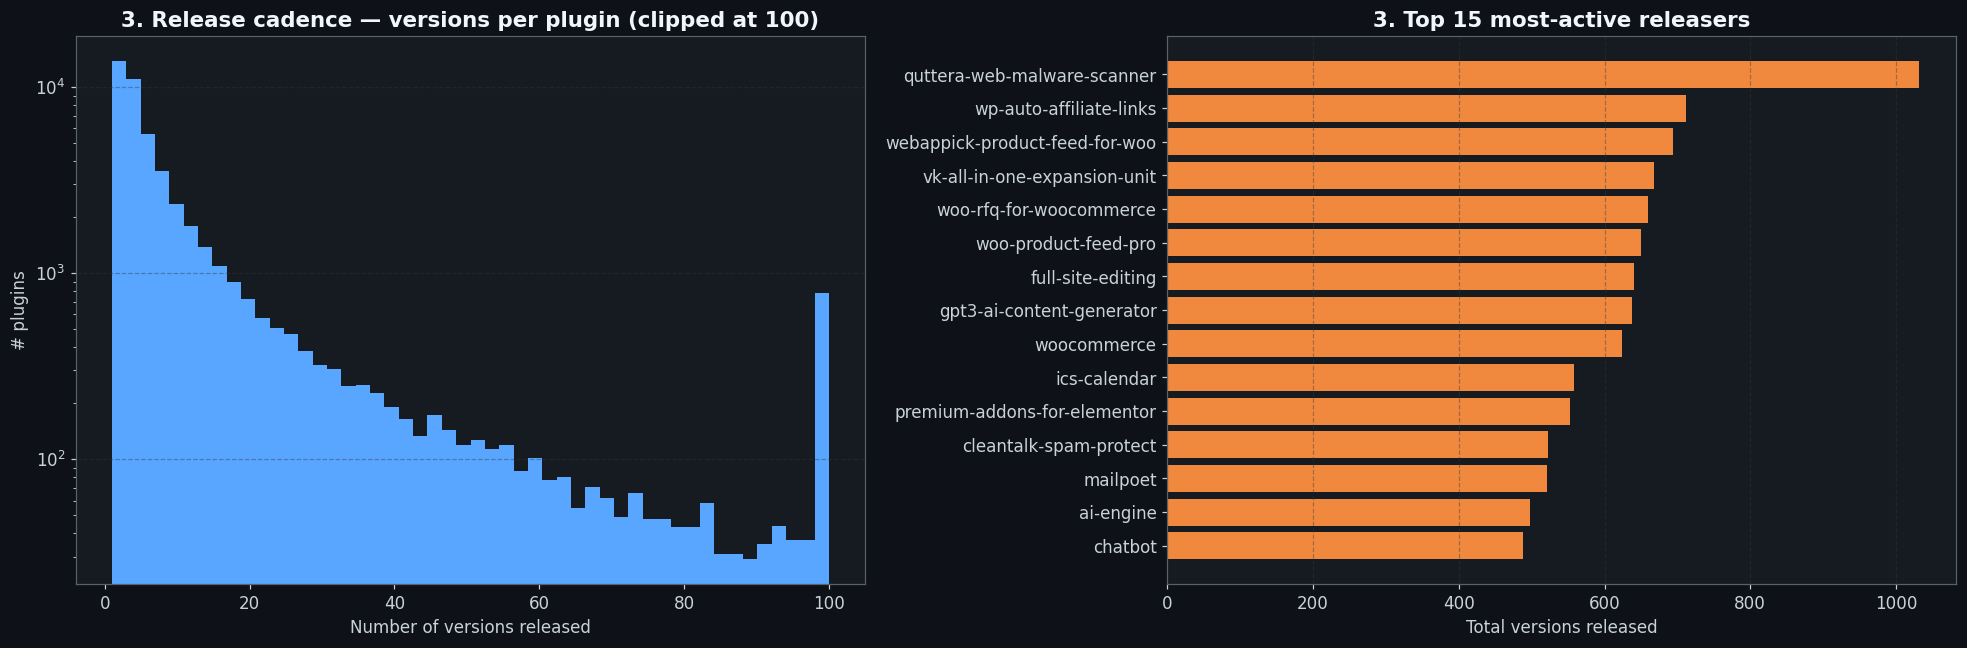
84% of WordPress.org plugins declare exactly one contributor in their readme, 53,174 plugins in the current catalog. That’s a self-reported field with some noise (some solo authors don’t list themselves, some team plugins under-declare), but the signal is consistent enough across cohorts and category breakdowns that the underlying pattern almost certainly holds: WordPress plugin development is, structurally, a mostly solo activity. The median plugin exists because one person had a problem, built a solution, packaged it, went through the WordPress.org review process, and published it. The median version count for solo plugins is 3, suggesting most receive only light ongoing maintenance, though version-tagging conventions vary widely across authors.
The install distribution tells the scaling story clearly:
| Team size | Plugins | Mean installs | Mean rating |
|---|---|---|---|
| 1 (solo) | 53,174 | 2,517 | 92.19 |
| 2–3 | 8,644 | 12,146 | 92.29 |
| 4–5 | 1,083 | 33,953 | 92.87 |
| 6–10 | 433 | 86,065 | 93.49 |
| 11+ | 75 | 304,418 | 87.73 |
Going from solo to a 2–3 person team multiplies mean installs by roughly 5×, from 2,517 to 12,146. Getting to 4–5 contributors pushes mean installs past 33,000, a 13× increase over solo. At 6–10 contributors, mean installs hit 86,065, 34× the solo baseline. At 11+ contributors: 304,418 mean installs, more than 120× what a solo plugin averages. The scaling relationship is not linear; it’s closer to exponential in its early stages. The jump from 1 to 2 contributors is not about twice as much code or twice as many commits, it’s about sustained maintenance, support, distribution, and the compounding effects of shared ownership.
The rating numbers are the interesting counterpoint. From solo through 6–10 contributors, mean ratings are essentially flat: 92.19, 92.29, 92.87, 93.49. Quality holds. Then at 11+ contributors, the mean rating drops to 87.73, a notable cliff. The install volume at that tier is dominated by plugins like WooCommerce’s official auxiliaries, Yoast’s full suite, and major commercial players, plugins that get enormous adoption because of distribution and bundling agreements, not exclusively because users love them.
These plugins attract critical reviewers. Users who install a plugin because it’s the default option for a major platform don’t give the same charitable reviews as users who actively sought something out. The 87.73 rating at 11+ contributors is less an indictment of large teams and more a reflection of what happens to user expectations when a plugin becomes mandatory infrastructure.
Two figures from the co-contributor data are worth naming directly. The platform’s single most common “contributor” by plugin count is not a person, it’s Freemius, the licensing and e-commerce SDK for WordPress plugins, appearing in 449 plugins. Freemius auto-injects itself as a contributor when plugin authors integrate the SDK. It is the invisible commercial infrastructure layer under roughly 1.5 million installs’ worth of plugins. When you see “contributor” on a WordPress plugin page, there’s a 449-plugin chance you’re looking at a monetization platform, not a developer.
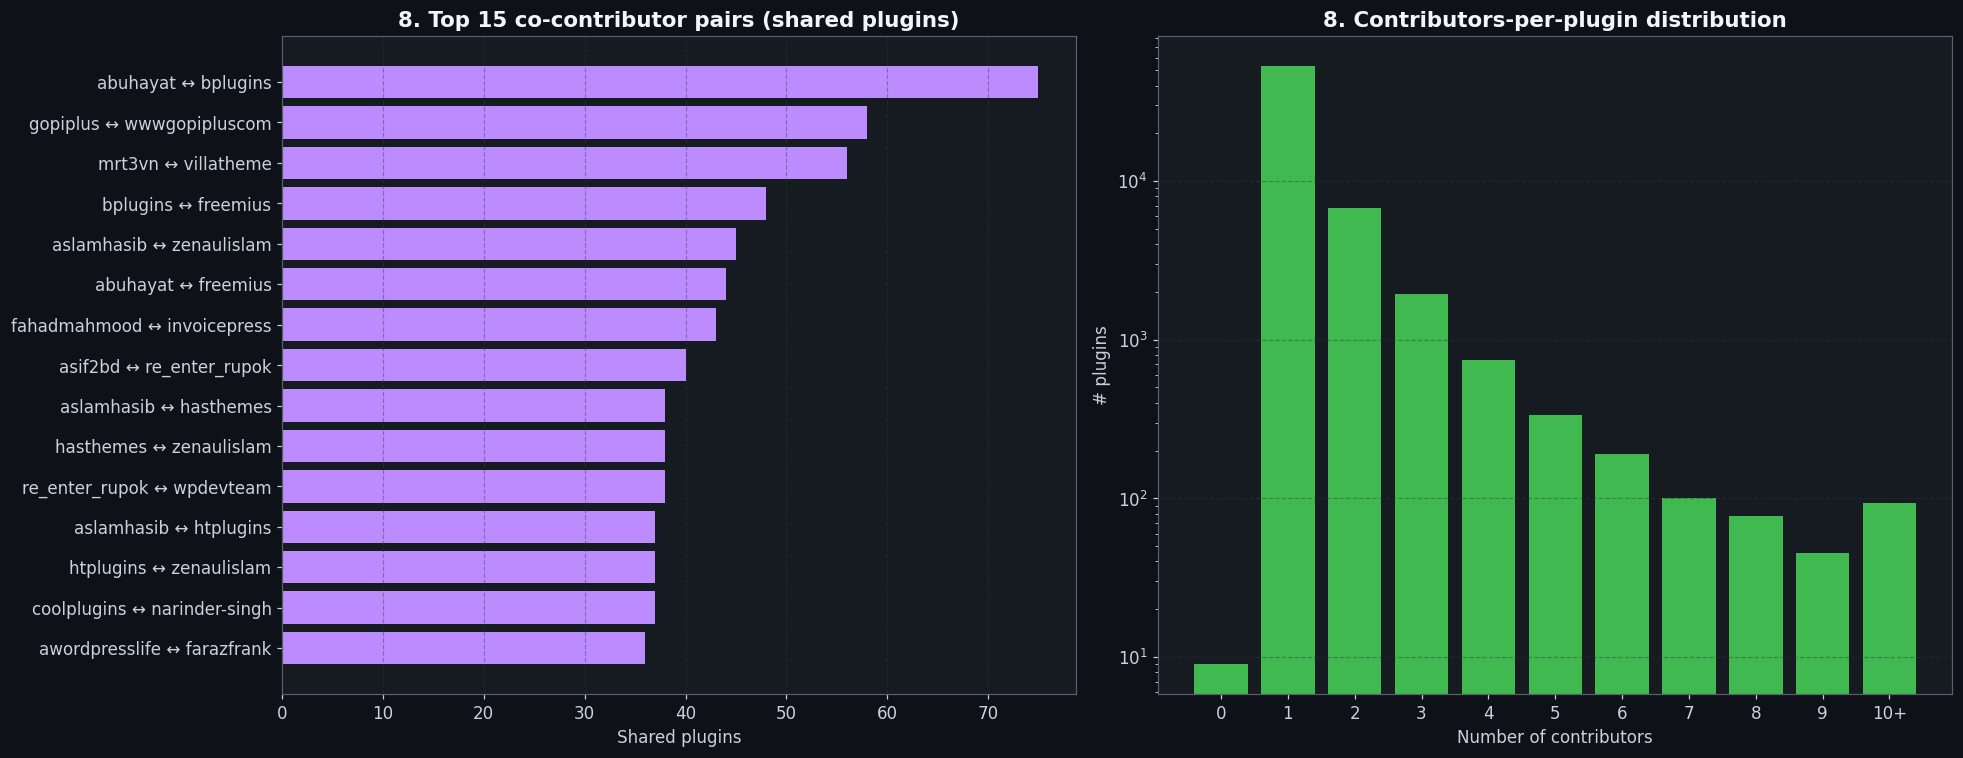
The other figure worth naming is the abuhayat ↔ bplugins pair, which shares 75 plugins, the highest collaborator count of any pair on the platform. This is a development hub that has become one of the largest sources of Elementor add-ons on WordPress.org. The pair operates at portfolio scale, dozens of niche single-block or single-feature plugins, each targeting a specific Elementor use case, collectively accumulating significant install volume across the catalog. It’s a model that looks unusual until you recognize that it’s structurally rational: build 75 small things instead of one large thing, and the WordPress.org discovery system surfaces each one independently.
Two parallel observations: 84% of plugins are solo work, and the highest-collaborating pair on the platform shares 75 plugins. Most of WordPress’s creative work happens alone. The scaling ceiling on solo work is 2,517 mean installs, a respectable contribution, but nowhere near the platform’s center of mass. The plugins that generate serious install counts are almost invariably team efforts. Solo development is how the ecosystem sustains its depth and long-tail diversity. Teams are how it generates its install volume. Both are necessary; they’re just doing different jobs.
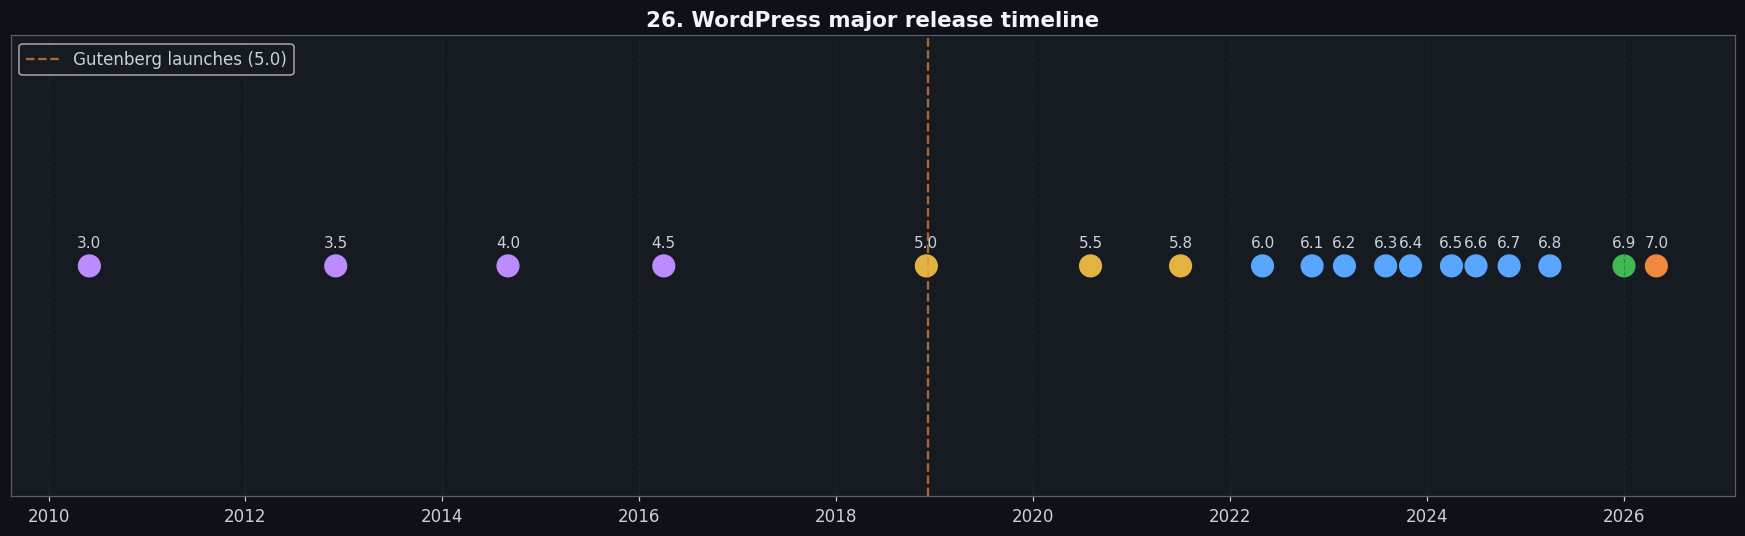
6. Gutenberg’s slow conquest
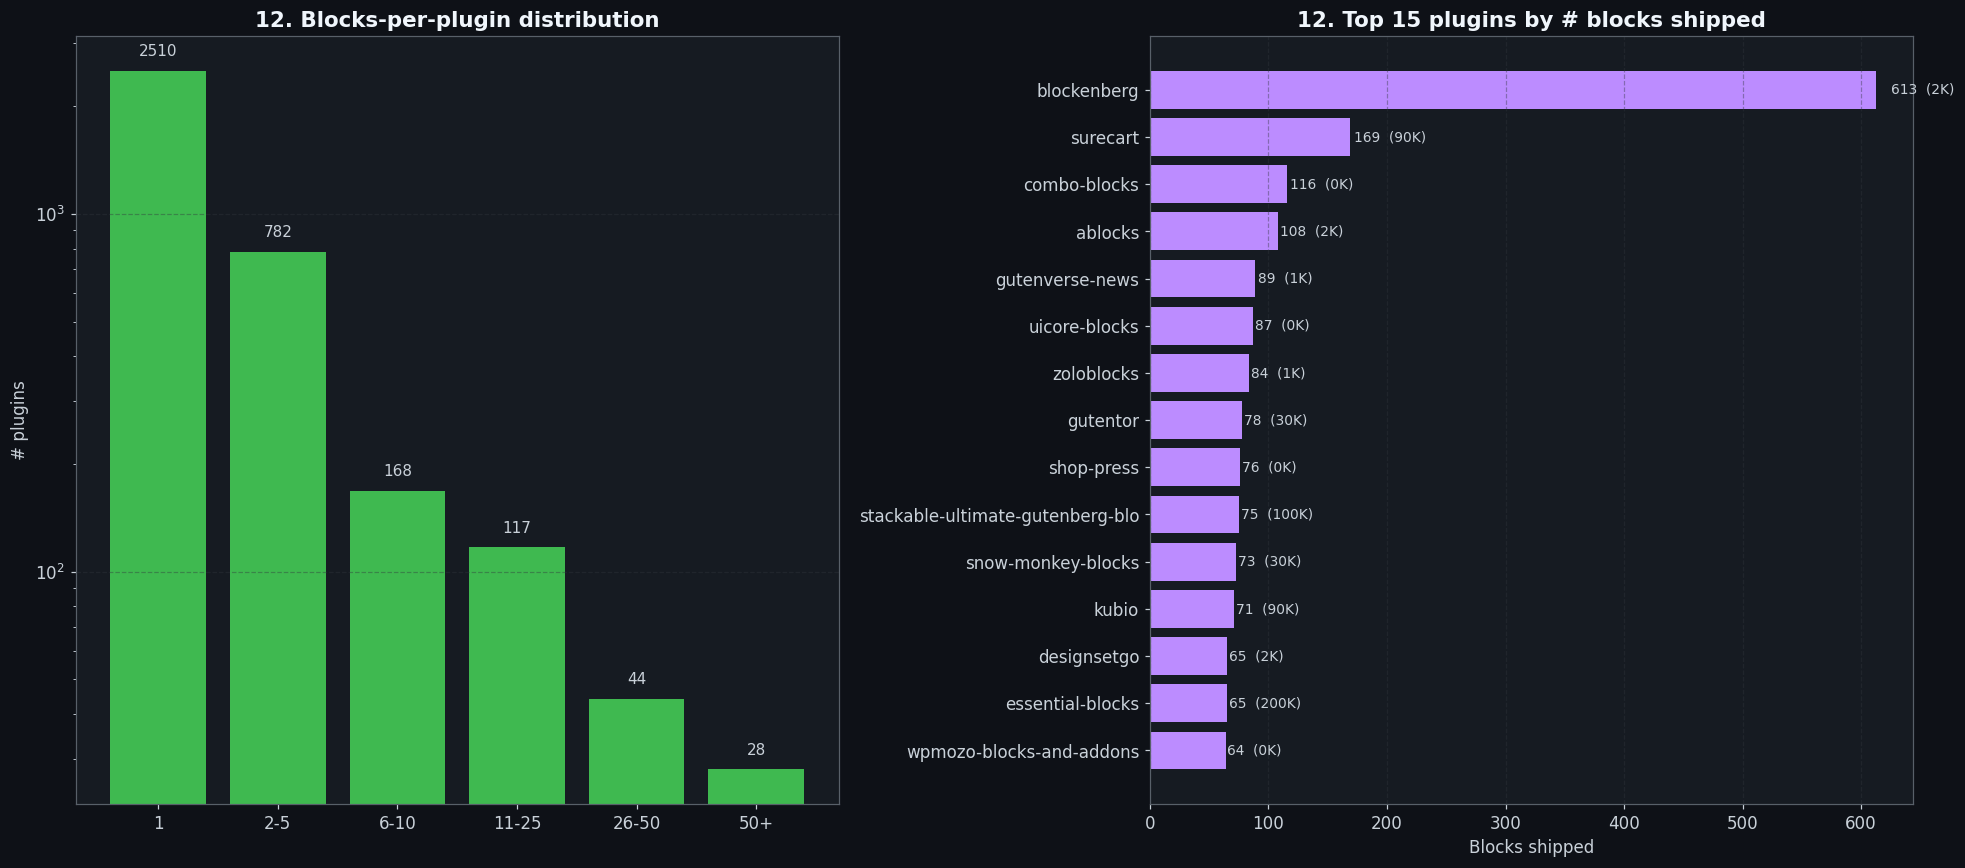
Gutenberg launched in December 2018. That’s more than seven years ago. The WordPress plugin statistics on its adoption are bleaker than anyone wants to admit. In that time, the block editor has shipped hundreds of releases, gained full-site-editing capability, matured into the primary narrative of WordPress core development, and been the subject of more conference talks, blog posts, and heated Slack threads than any other topic in the WP ecosystem. And yet: 5.8% of plugins, 3,649 out of 63,418, ship at least one Gutenberg block. 11,933 total blocks exist across the entire corpus. The remaining 93% of plugins were written before Gutenberg or have simply never engaged with it.
The 5.8% figure understates how bottom-heavy the block ecosystem is. Of those 3,649 block-shipping plugins, 68.8% ship exactly one block. Two thousand five hundred and ten plugins looked at the Gutenberg API, built one thing, and stopped. The tier that ships serious block suites, 25 blocks or more, is only 72 plugins. The handful that have actually committed to block-first architecture can be counted without much difficulty.
The class breakdown reveals the more interesting divide:
| Class | Plugins | % | Mean rating |
|---|---|---|---|
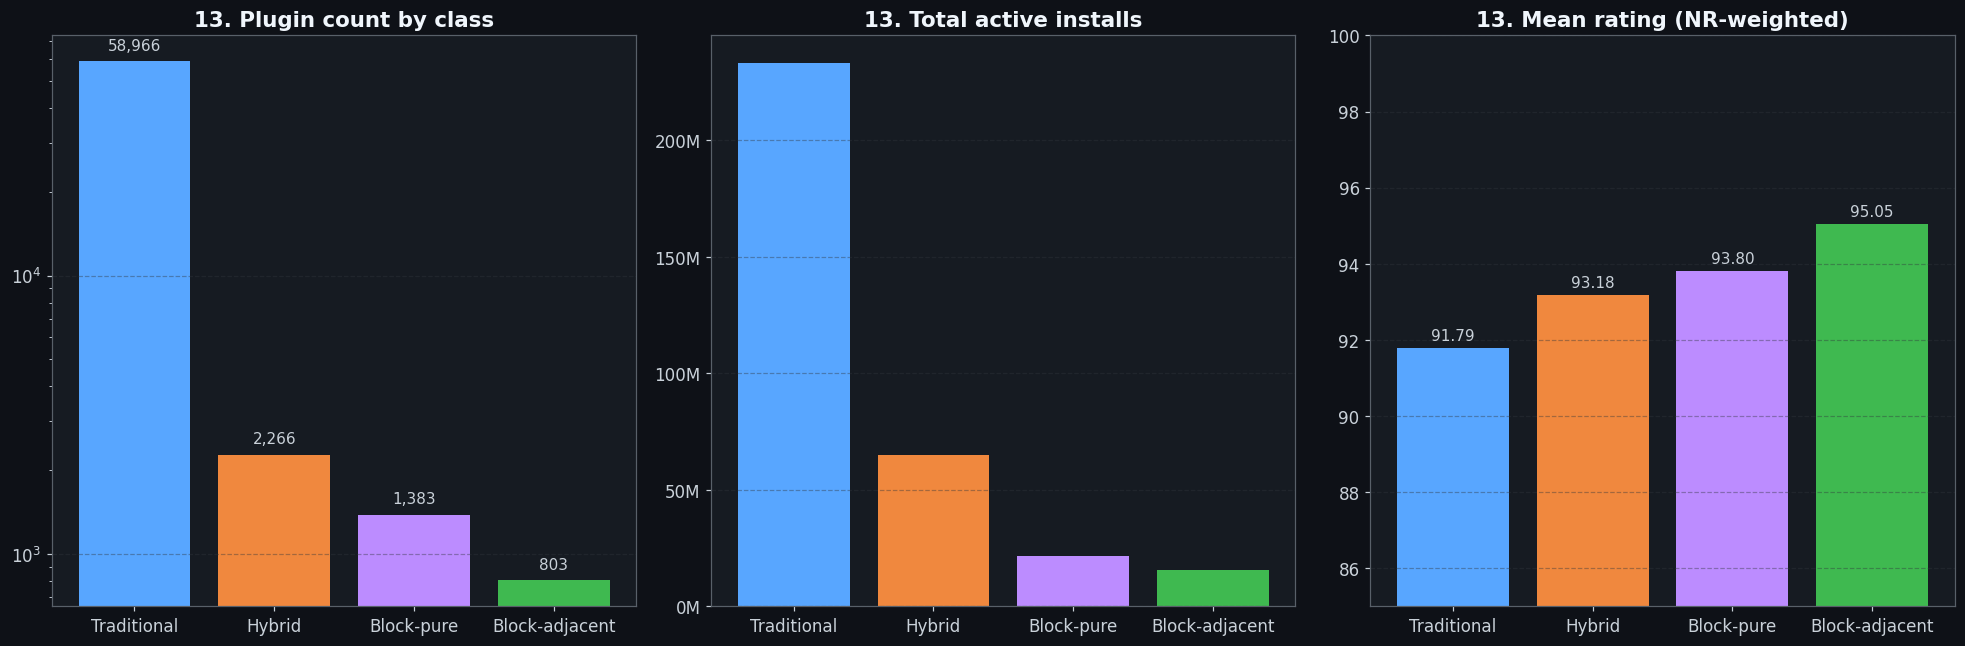
| Traditional (no blocks) | 58,982 | 93.0% | 91.79 |
| Hybrid (blocks alongside traditional) | 2,330 | 3.7% | 93.18 |
| Block-pure (≥5 blocks, or block-tagged + ships blocks) | 1,319 | 2.1% | 93.80 |
| Block-adjacent (tagged as block plugin, ships zero blocks) | 787 | 1.2% | 95.31 |
The weirdest data point in this entire section, and arguably the whole dataset, is Block-adjacent. These are 787 plugins that put gutenberg, block, or gutenberg-blocks in their tags and description, but ship zero actual blocks. They are, in the most literal sense, marketing about Gutenberg without doing Gutenberg. And they rate 95.31, the highest mean rating of any class, higher than plugins that actually built blocks. The gap is small in absolute terms, 3.5 points on a 100-point scale where almost everything clusters between 88 and 96, but it’s consistent: Block-adjacent outperforms Traditional by 3.5 points and Block-pure by 1.5 points across thousands of plugins on each side. The takeaway isn’t that shipping zero blocks is the winning strategy; it’s that the user value Gutenberg-adjacent plugins create isn’t reliably coming from shipping the blocks themselves.
The install distribution has its own lesson. Blockenberg ships 613 blocks, the most of any plugin in the corpus, nearly triple the next competitor, and sits at 2,000 installs. Essential Blocks ships 65 blocks and has 200,000 installs. Block count is not the driver of adoption. Integration quality, documentation, marketing, and user experience are. The block ecosystem does have real winners, Stackable at 100K installs, Essential Blocks at 200K, Gutentor at 30K, but they’re plugins that built coherent systems, not plugins that maximized block counts.
The macro conclusion is hard to escape: eight years after Gutenberg launched, 93% of the WordPress plugin catalog hasn’t shipped a single block. The platform narrative says Gutenberg is the future of WordPress. The data says the future is moving at the speed of developer motivation, and that speed is slower than anyone officially admits.
7. The platform is healthier than it looks (just not at the bottom)
There are two true things about the WordPress plugin statistics that point in completely opposite directions, and both of them need to be said.
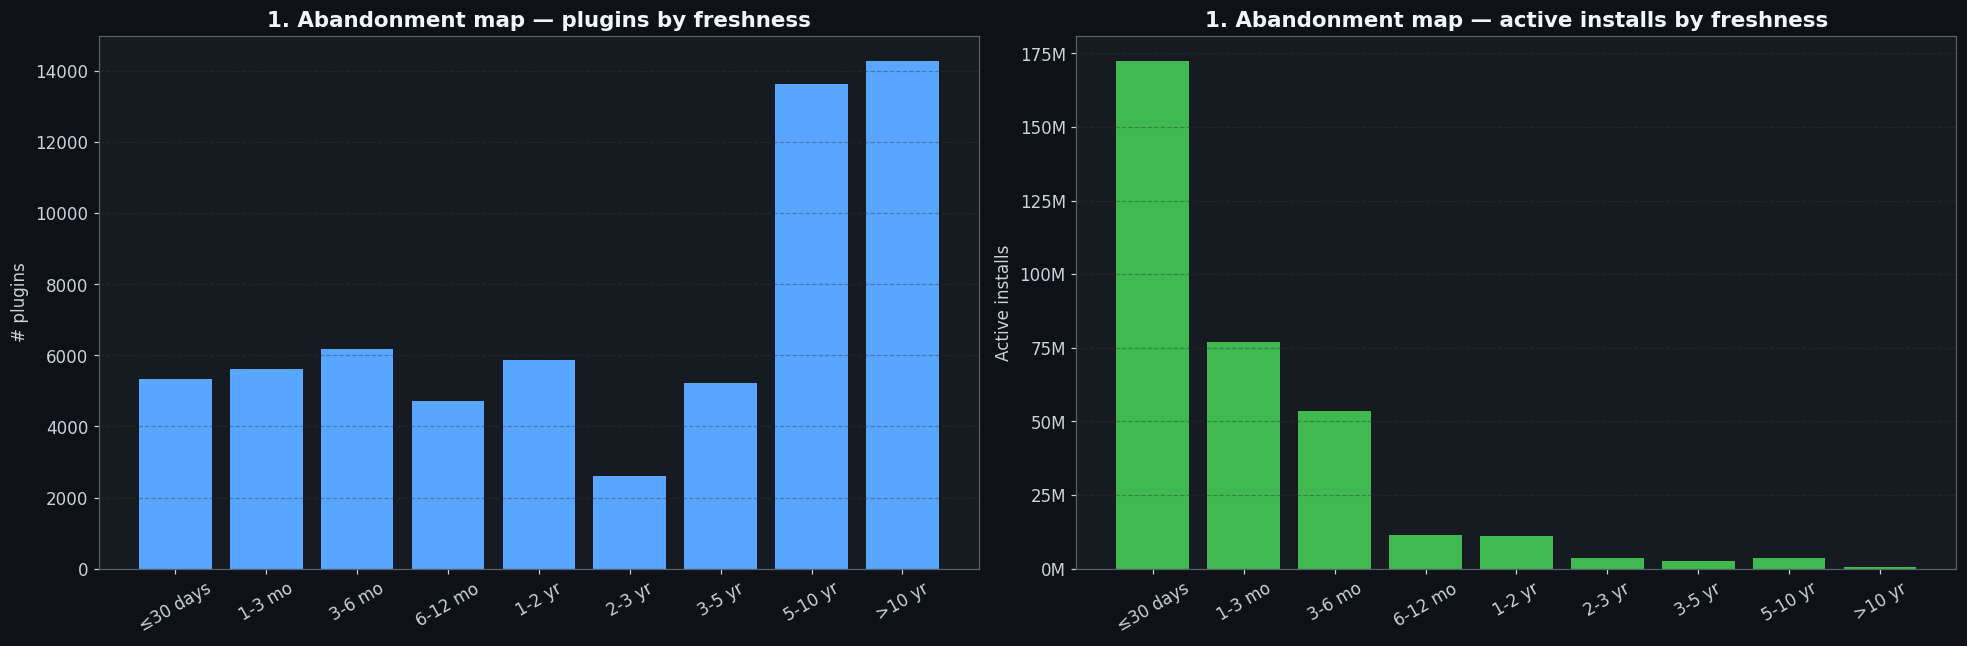
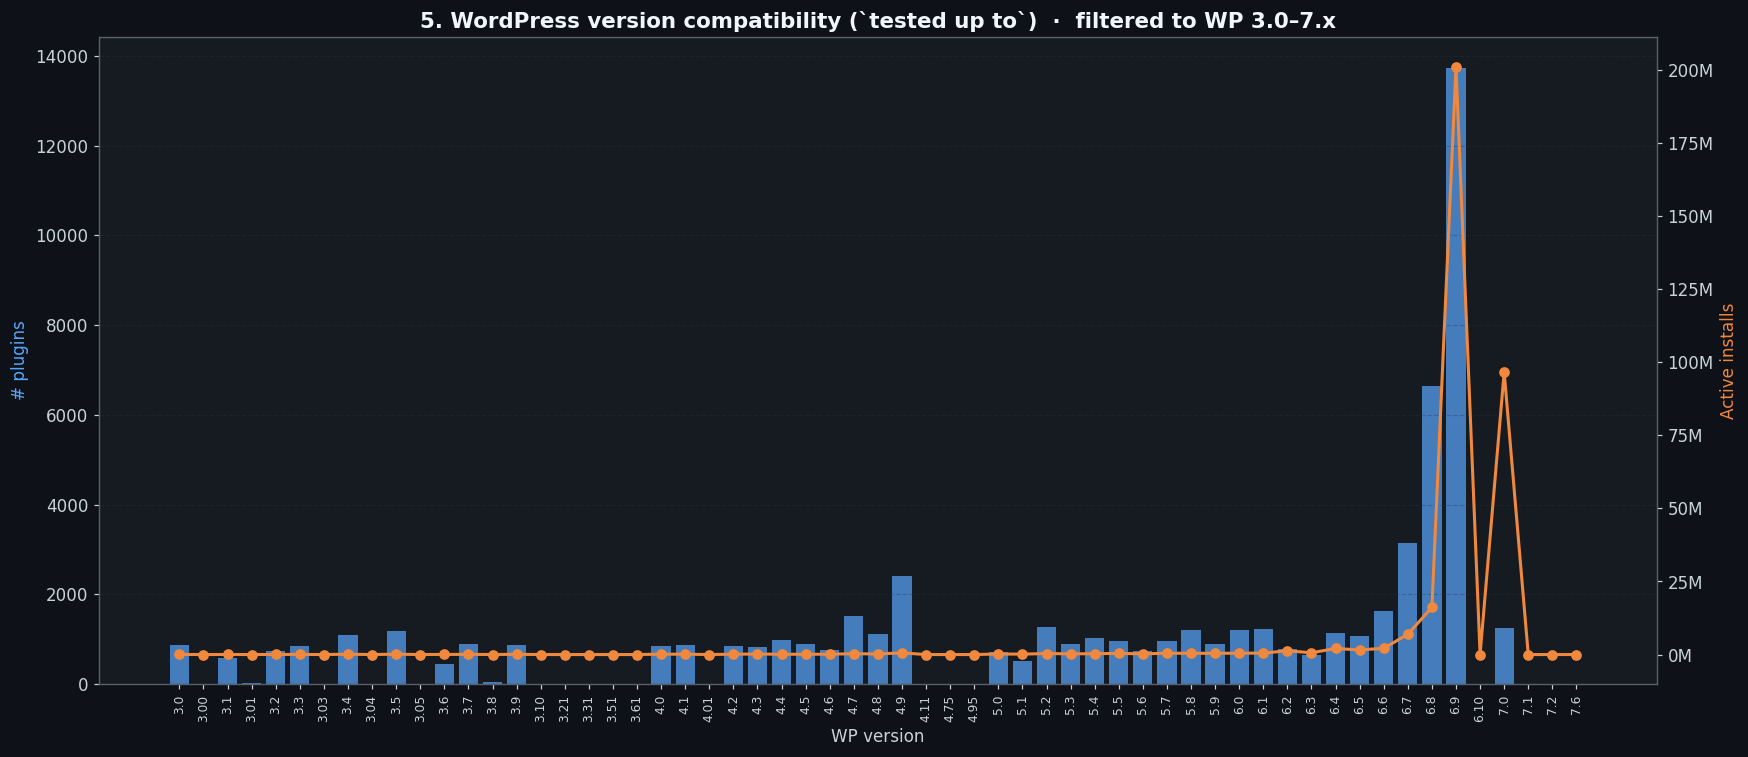
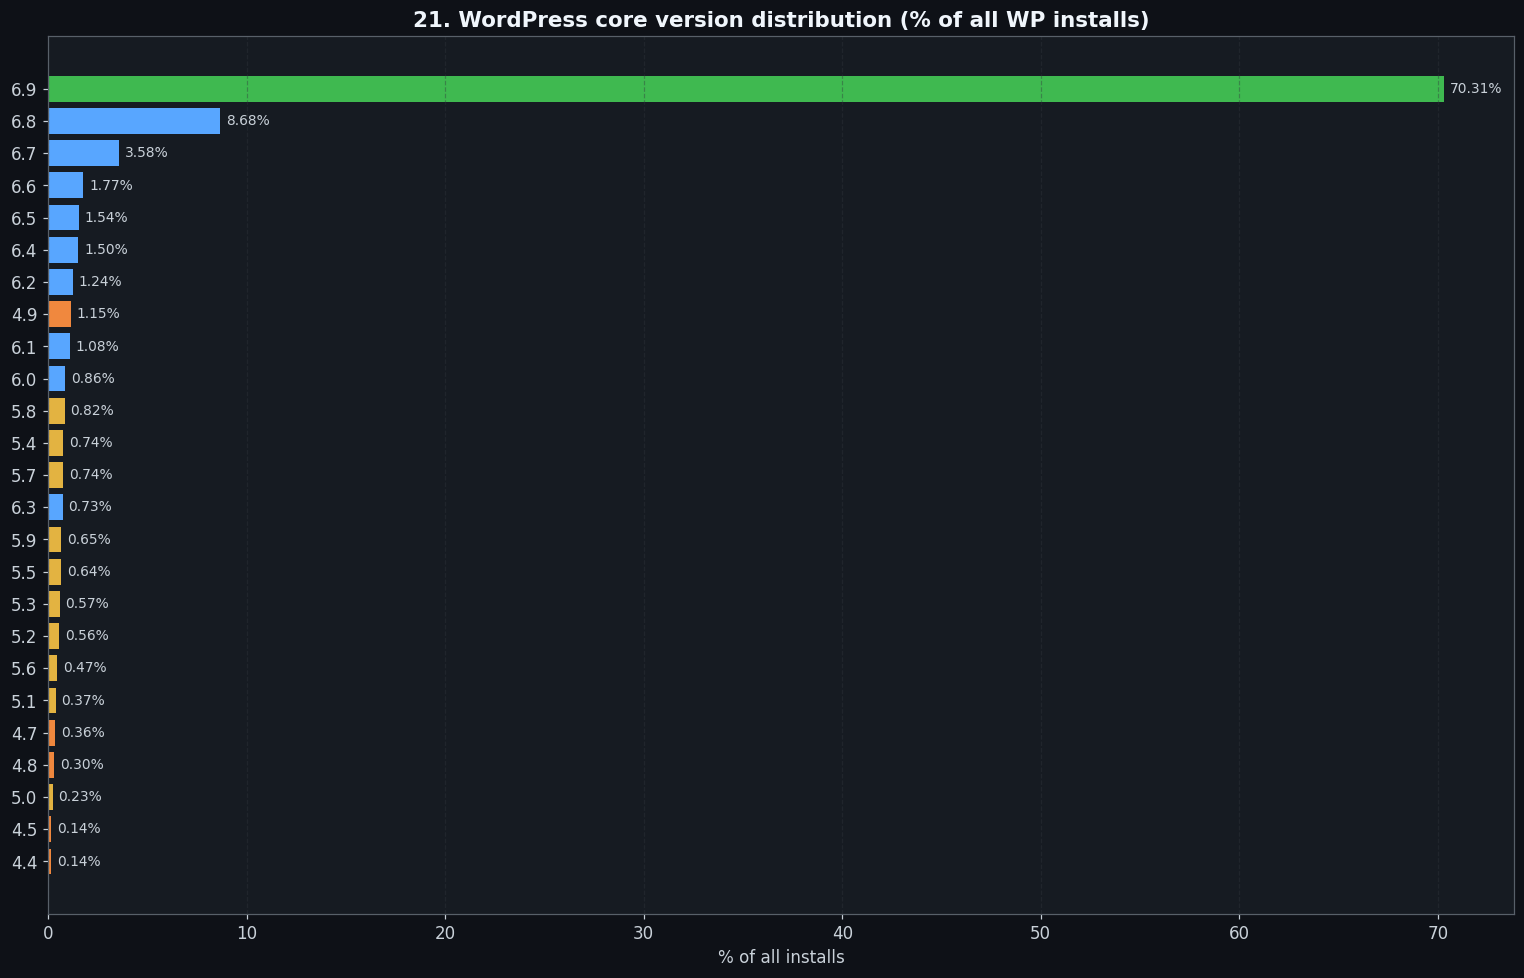
The first true thing: at the top of the install distribution, the platform is actively maintained. 51.3% of all WordPress plugin installs sit on plugins that were updated in the last 30 days. More than half the install volume, on the order of 170 million installs by lower-bound estimate, is on code that was touched by a developer within the last month. The WP version distribution tells the same story: 70.31% of all WordPress sites run WP 6.9, the current major release. 91.29% are on WP 6.x. The active install base is overwhelmingly on modern, maintained software. There’s no evidence here of a platform in decay at its center of mass.
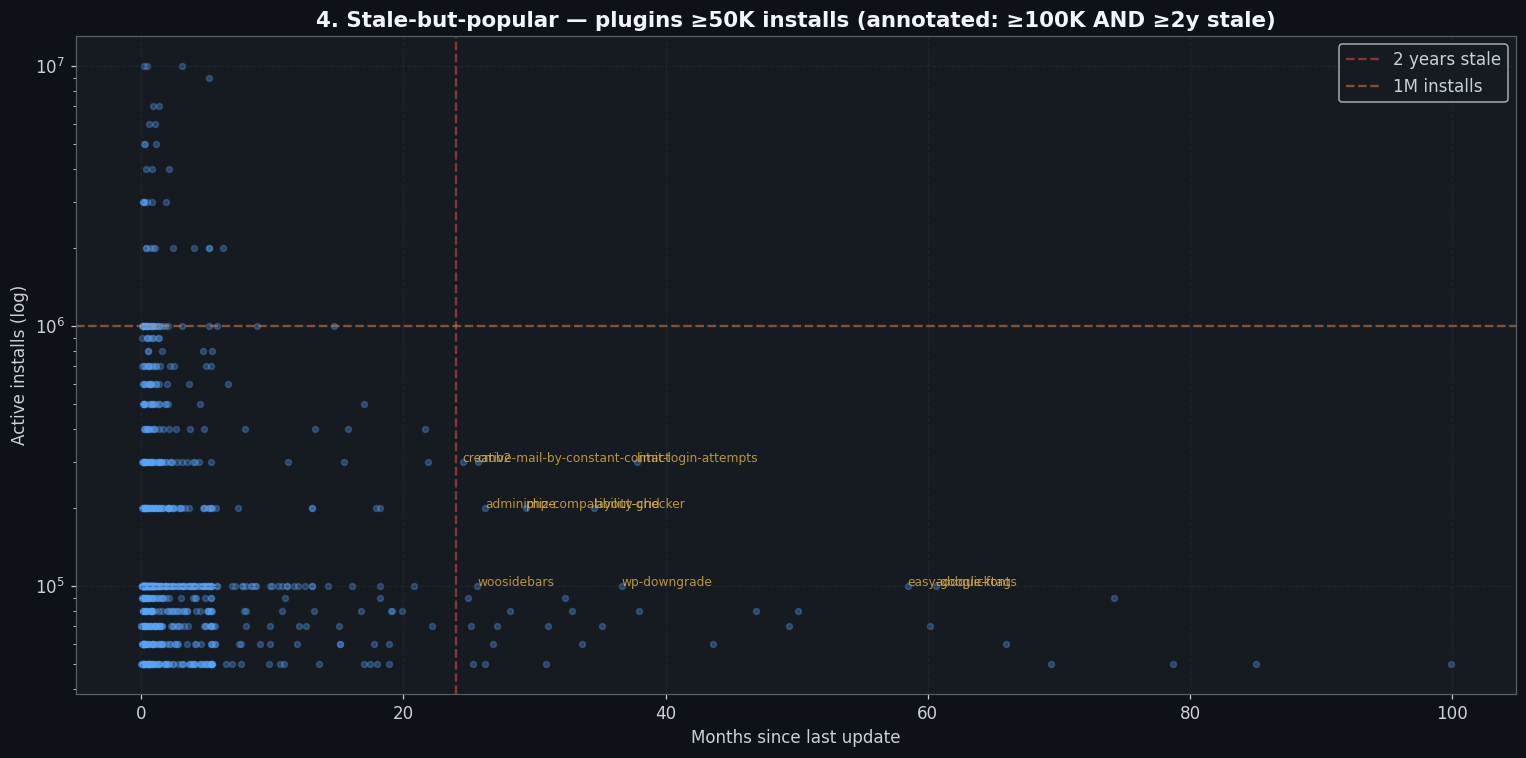
The second true thing: at the bottom of the plugin catalog, there is a fossilized long tail of genuinely abandoned software. 56.3% of plugins, 35,732 out of 63,418, have not been updated in two or more years. More than a fifth of the entire catalog, 22.5% of plugins, haven’t been touched in a decade. These aren’t plugins that were quietly sunset; they’re just sitting there in the catalog, some of them still indexed and theoretically installable. 22.5% of plugins hold 0.2% of installs, the decade-old abandonware tier is essentially inert in terms of real-world impact, but the catalog count is genuinely shocking when you first look at it.
The mechanism that reconciles these two facts is user migration pressure. When a plugin stops being maintained, users notice, through broken functionality, security disclosures, or simply WordPress.org’s own “not tested with recent versions” warnings, and they switch. The 56.3% abandonment rate does not translate into 56.3% of users running stale software. It translates into 3.1% of installs. The selection pressure toward actively maintained plugins is real and strong at every level of the install distribution above zero.
One number that puts this in context: WordPress core’s security team backports security fixes to older major versions as a courtesy practice, currently extending back to WP 4.7 (released December 2016). That’s roughly nine years of backwards-compatible security coverage, one of the longer such practices in the open-source CMS space, though the WordPress project’s official position is that only the latest version is supported. WP 4.9, the release that 1.15% of installs still run (more on that in the next section), is still receiving patches under that courtesy practice.
The honest read: WordPress is a two-tier platform. The top tier, the actively installed, actively maintained plugins serving the majority of WordPress sites, is in good shape. The bottom tier, the accumulated sediment of a decade of one-off publishing, recent-cohort experimentation, and abandoned personal projects, looks alarming in aggregate but exerts minimal impact on real users. The catalog count and the install count tell radically different stories, and the install count is the one that matters for anyone trying to assess platform health.
8. Surprise inventory: things I had to double-check
Some WordPress plugin statistics fit cleanly into a narrative. These eight didn’t, they were individually surprising enough that I ran the query twice before writing them down. No unifying theme. Just the raw weirdness of a 63,000-plugin corpus at sufficient magnification.
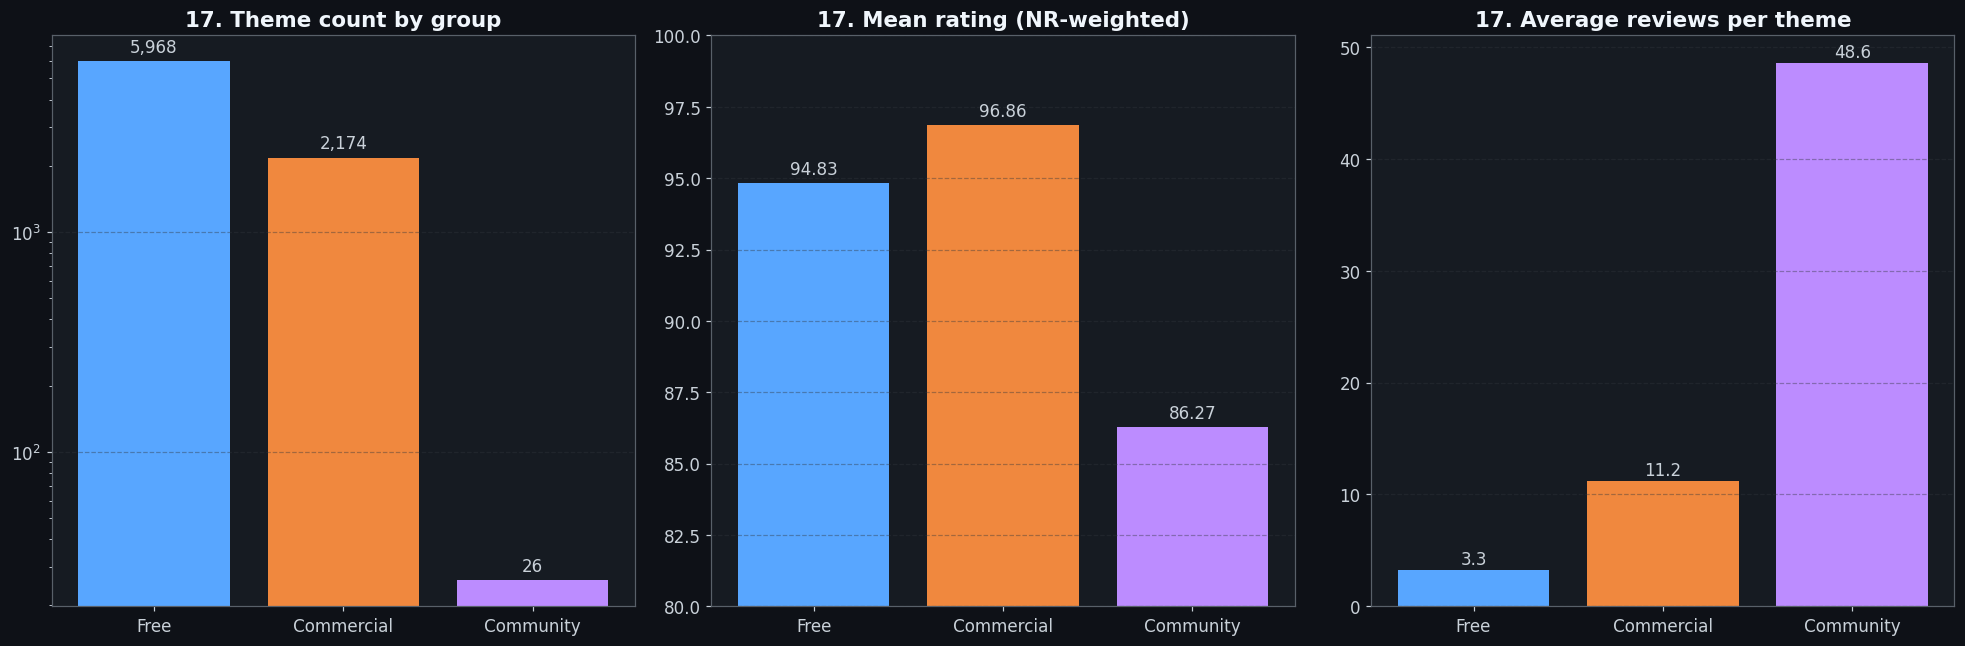
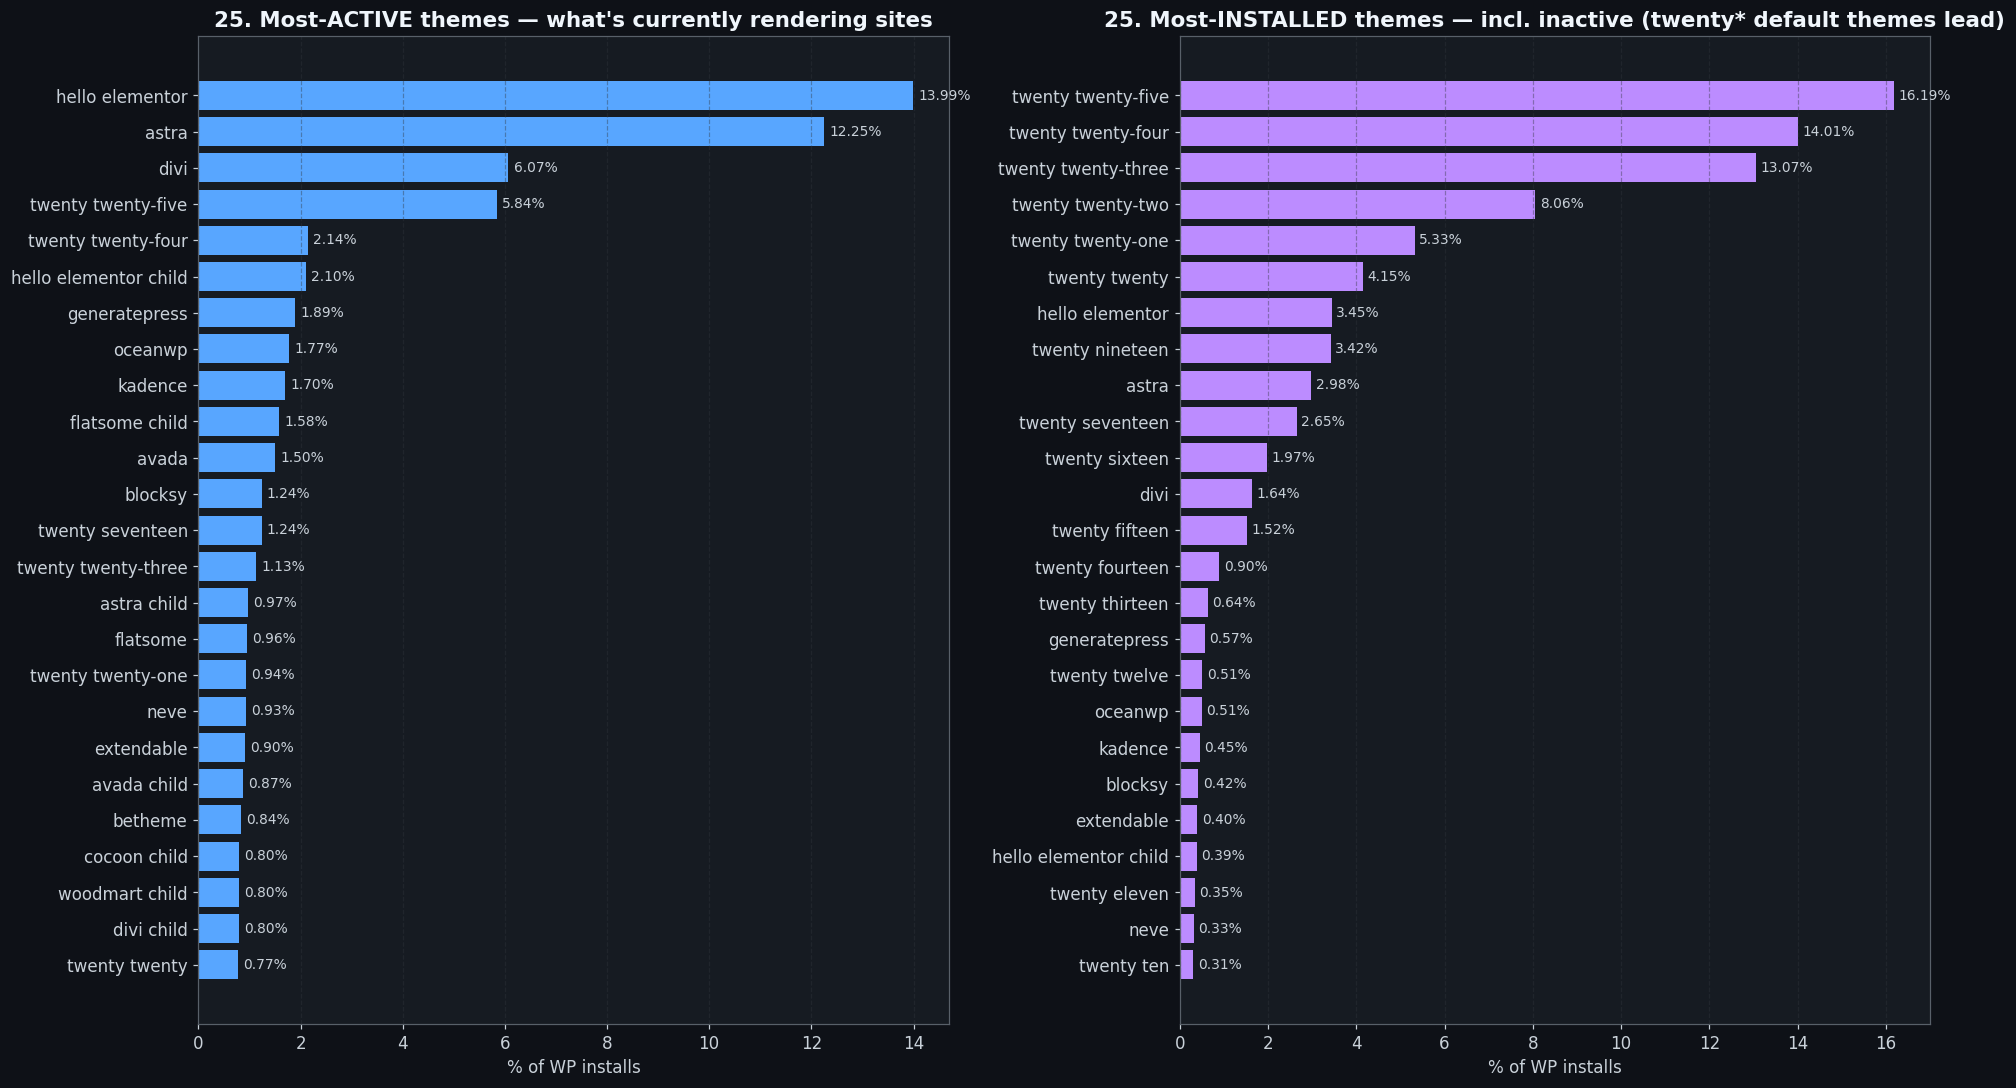
- Hello Elementor is the #1 active theme at 14%, and it does almost nothing by design. WordPress.org’s theme stats show Hello Elementor as the most-actively-used theme on the entire platform, ahead of Astra at 12.26% and Divi at 6.08%. The trick: Hello Elementor is a deliberately minimal starter theme for Elementor-based sites, it removes all the default styling so Elementor can control the full design. The theme’s dominance isn’t a statement about the theme. It’s a statement about how thoroughly page-builders have taken over site construction. When 14% of WordPress sites run a theme that is intentionally designed to be invisible, you’re looking at a platform where the page-builder is the product and the theme is scaffolding.
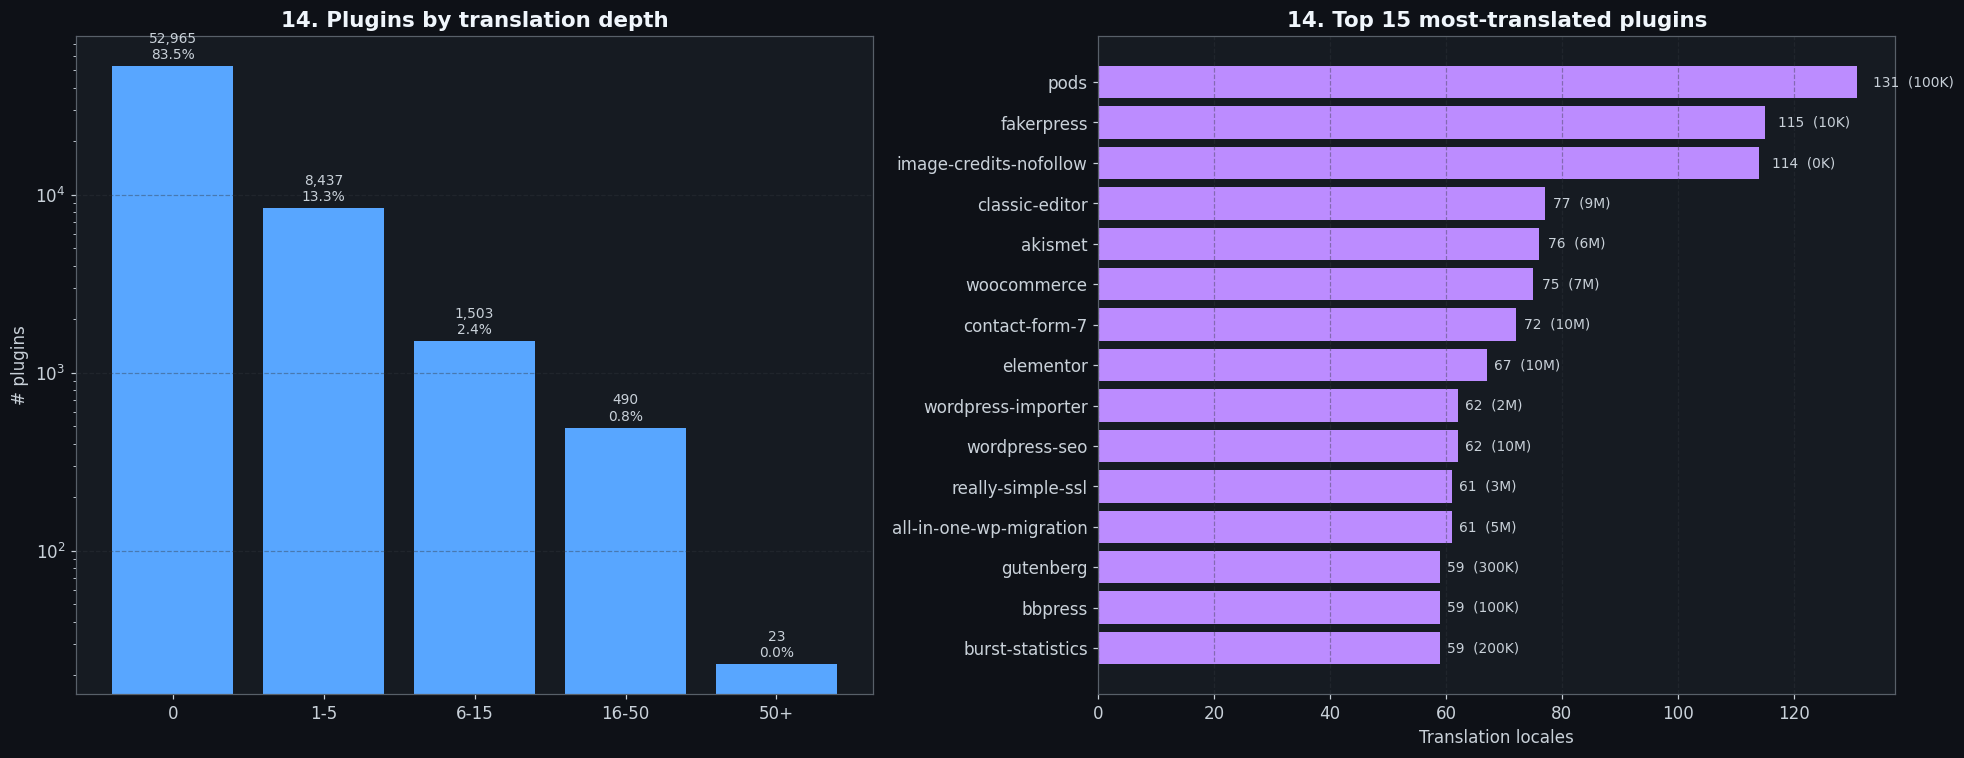
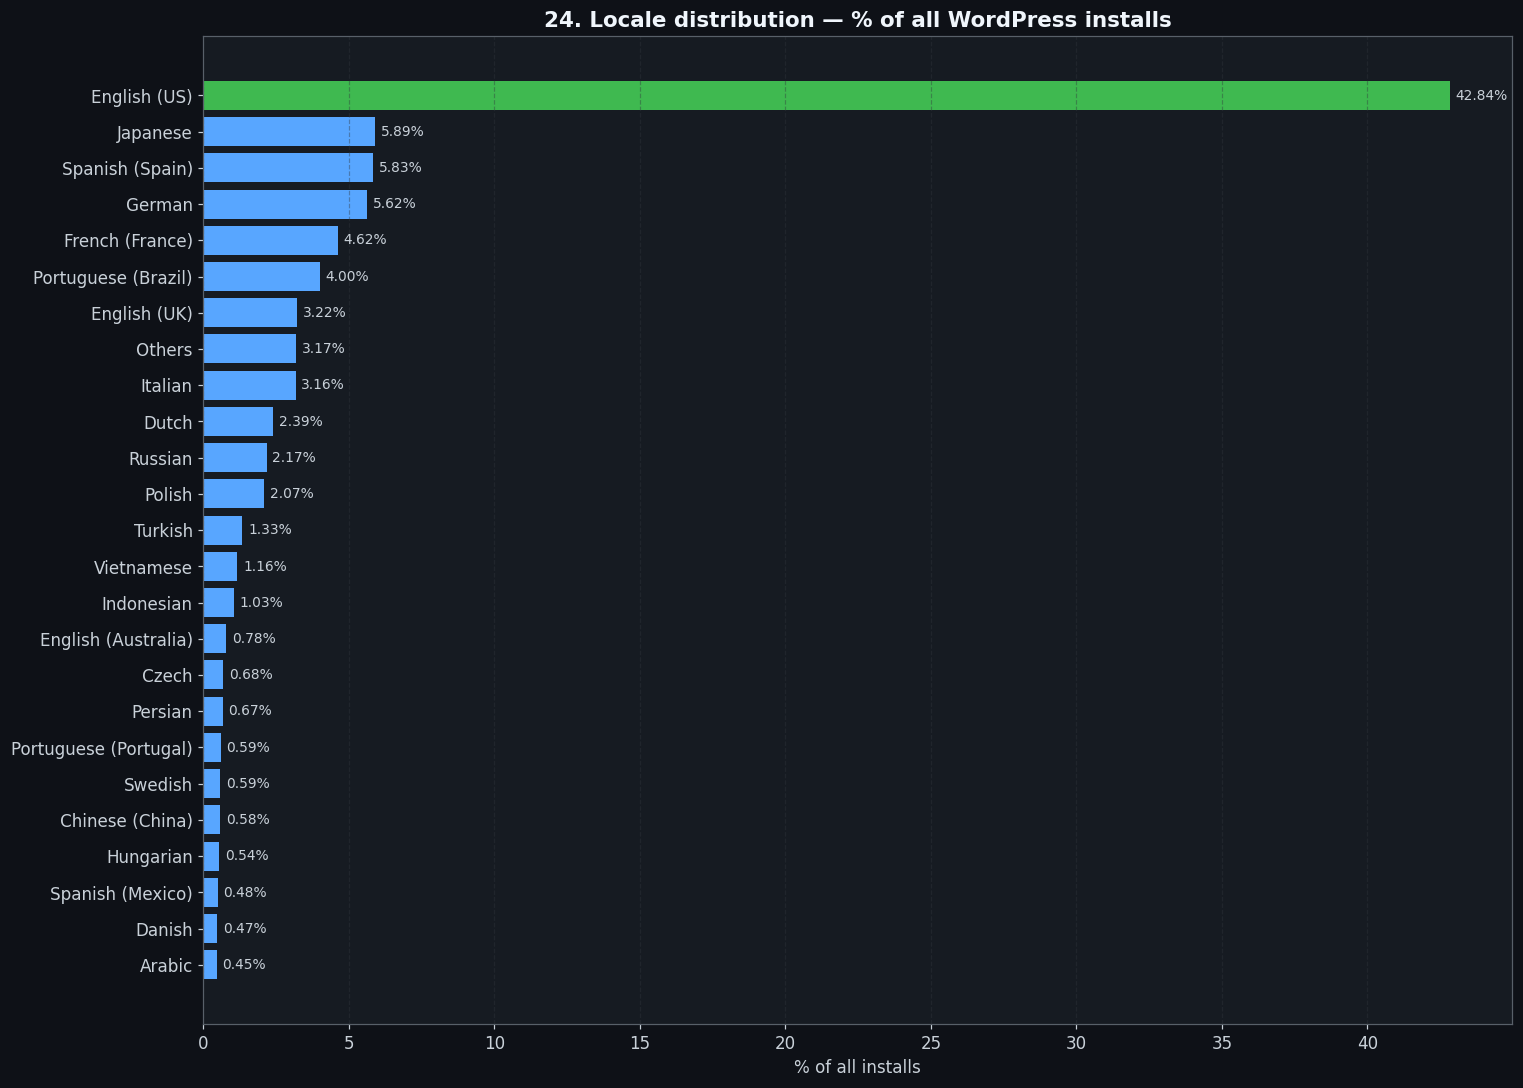
- Pods is translated to 131 locales, despite having only 100,000 installs. The i18n analysis finds that the most-translated plugin on WordPress.org is not WooCommerce (75 locales), not Contact Form 7 (72 locales), not even Elementor (67 locales). It’s Pods, a content architecture and custom post type plugin with a hundred thousand installs. The gap between Pods and everyone else is significant: 131 locales versus the 77 for Classic Editor in second place. The metric measures translation activity rather than coverage quality (a single translator submitting a single string still counts), but at this magnitude the signal is real: Pods has cultivated a remarkably committed internationalization community relative to its install base, punching well above its weight on i18n.
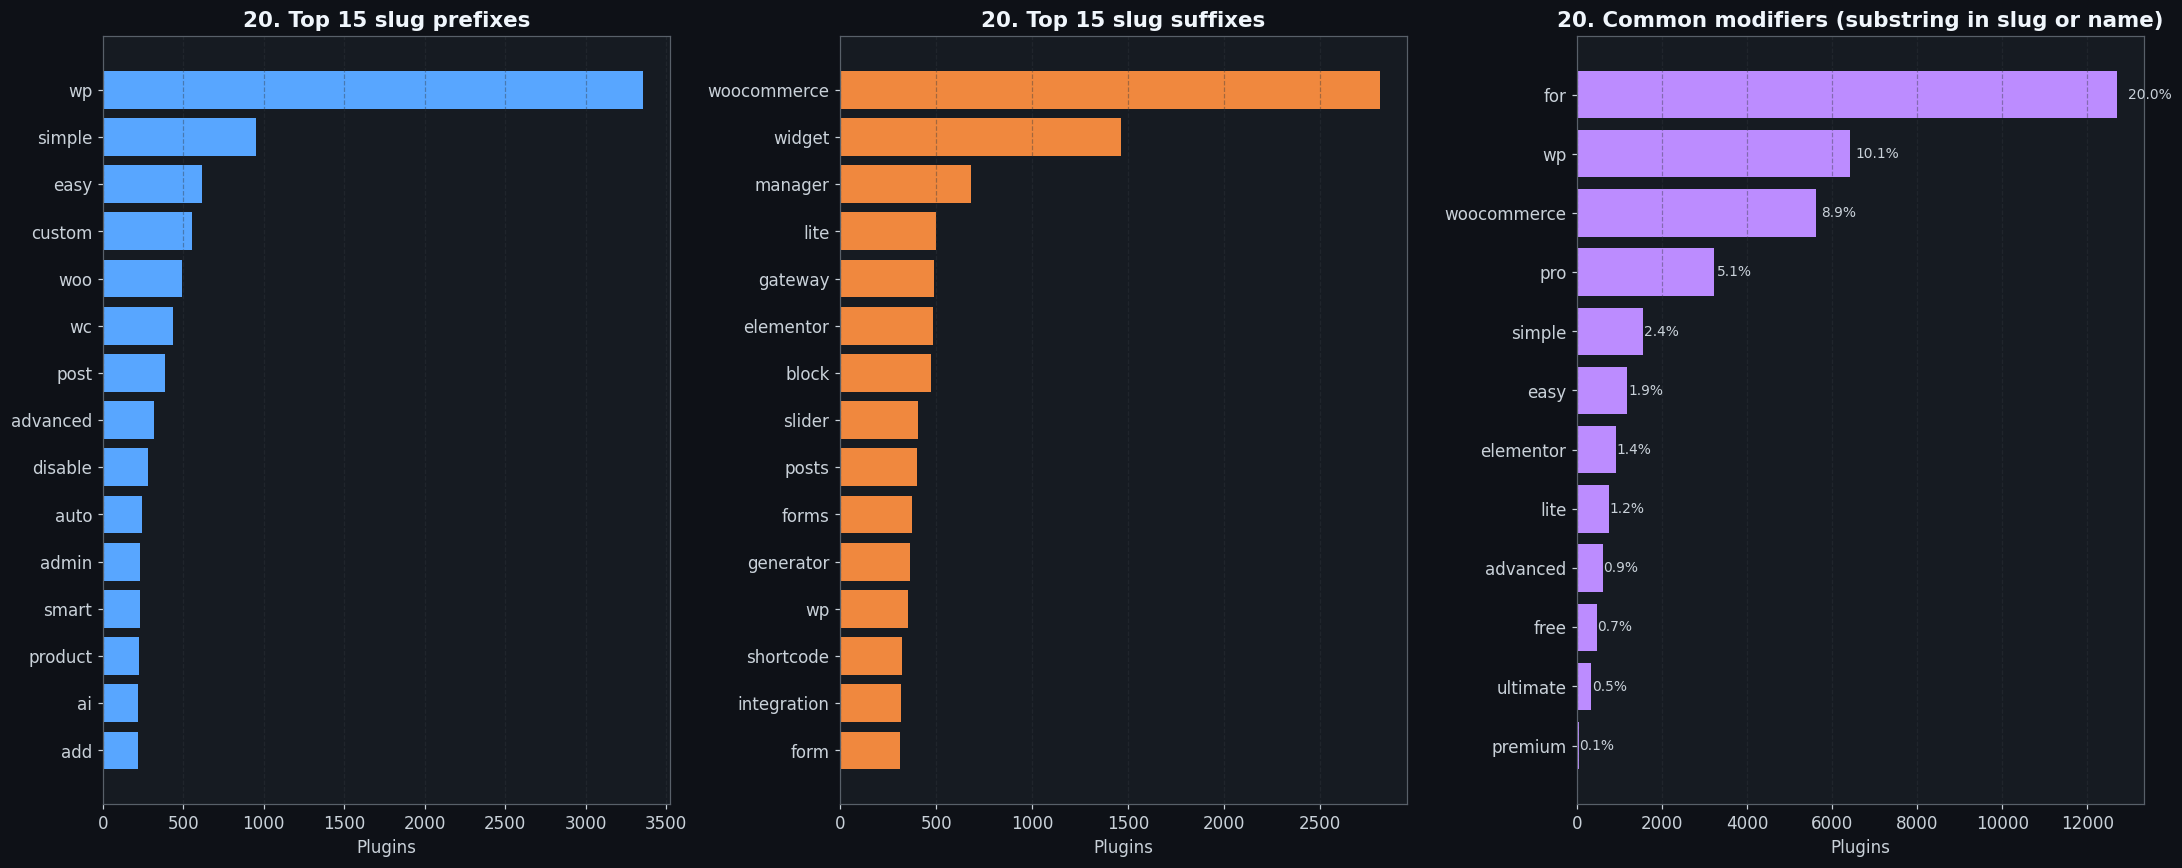
- 1 in 5 plugin names contains the word “for”, 12,629 plugins. “X for WooCommerce” / “Y for Elementor” / “Z for Gravity Forms” is not just common; it is the platform’s single most dominant naming convention by a large margin. The next-most-common modifiers, “wp” at 9.9%, “woocommerce” at 8.9%, are well behind. The “for” construction signals integration: this thing extends that other thing. At nearly 20% of all plugin names, it also signals something about how plugins find users. Appearing in a search for “WooCommerce” or “Elementor” is more valuable than any other SEO strategy on WordPress.org. The naming idiom follows the discovery strategy.
- “pro” beats “premium” 80:1 as the upmarket modifier, 3,117 plugins versus 39. When plugin authors want to signal that there’s a paid version, they reach for “pro” almost unanimously. “Premium” shows up in 39 plugin names. Why the ecosystem has converged so heavily on “pro” is genuinely unclear, possibilities include connotation (“pro” implying capability, “premium” implying cost), brevity, herd-mentality lock-in from early influential plugins, or general software naming conventions outside WordPress. What’s clear is the convergence has been decisive.
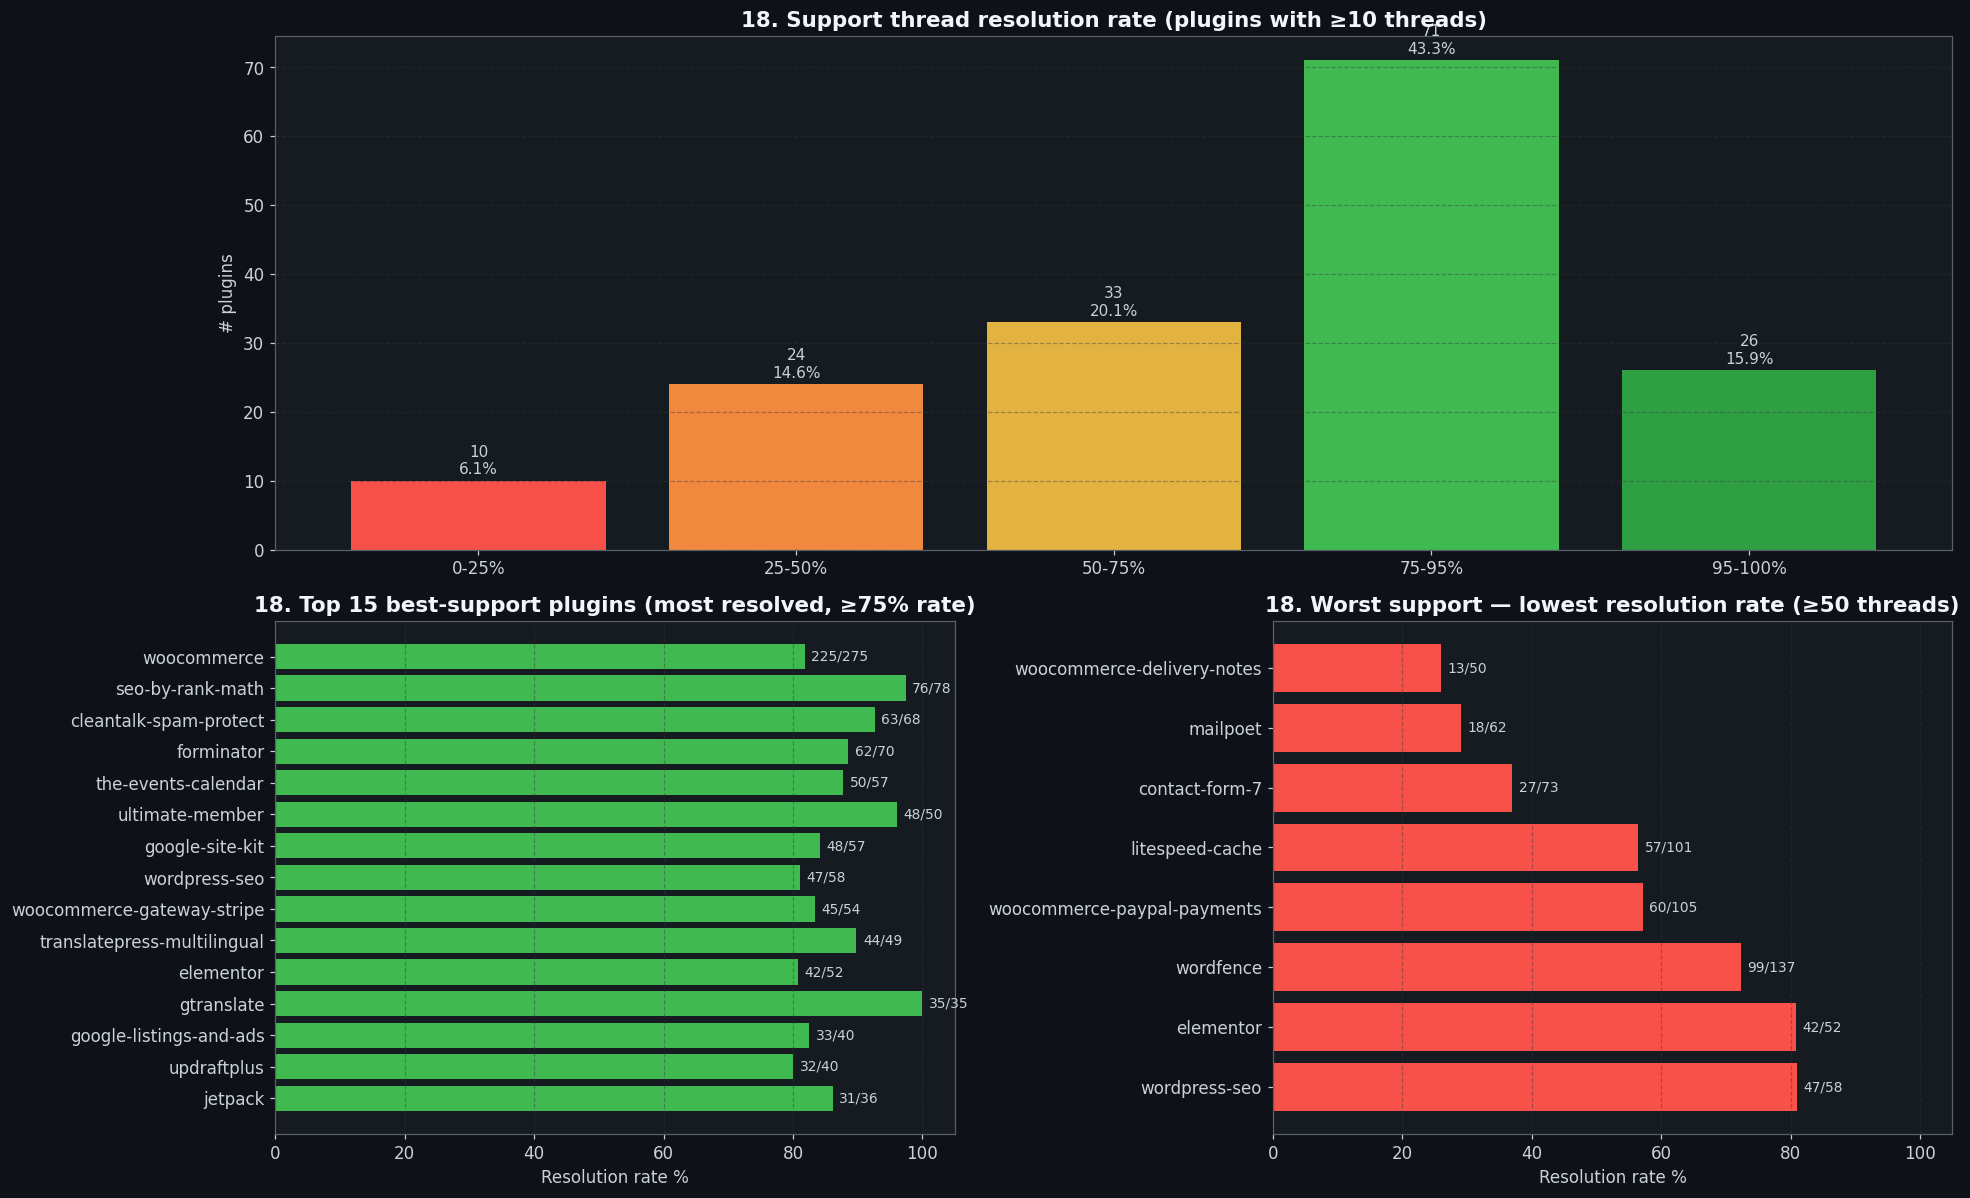
- Contact Form 7 has a 37% support resolution rate, one of the three most-installed plugins on the platform, with one of the worst support records. Among plugins with at least 50 active support threads, Contact Form 7 resolves only 37% of reported issues. For comparison, Rank Math SEO (4 million installs) resolves 97% of threads. Three plugins, gtranslate, wp-staging, and woo-product-feed-pro, resolve 100% of every thread they receive. Contact Form 7 isn’t uniquely terrible; MailPoet is at 29% and woocommerce-delivery-notes at 26%. But at 10 million installs, Contact Form 7 has the most visible support gap on the platform. The 80/100 rating is both a reflection of how useful the plugin is and how frustrated users get when they need help and can’t get it. Caveat worth flagging: WordPress.org’s resolution metric depends on forum participants marking threads as resolved, which is noisy. A plugin with engaged support staff who close threads diligently will look better than one with equally good fixes but less thread-hygiene discipline.
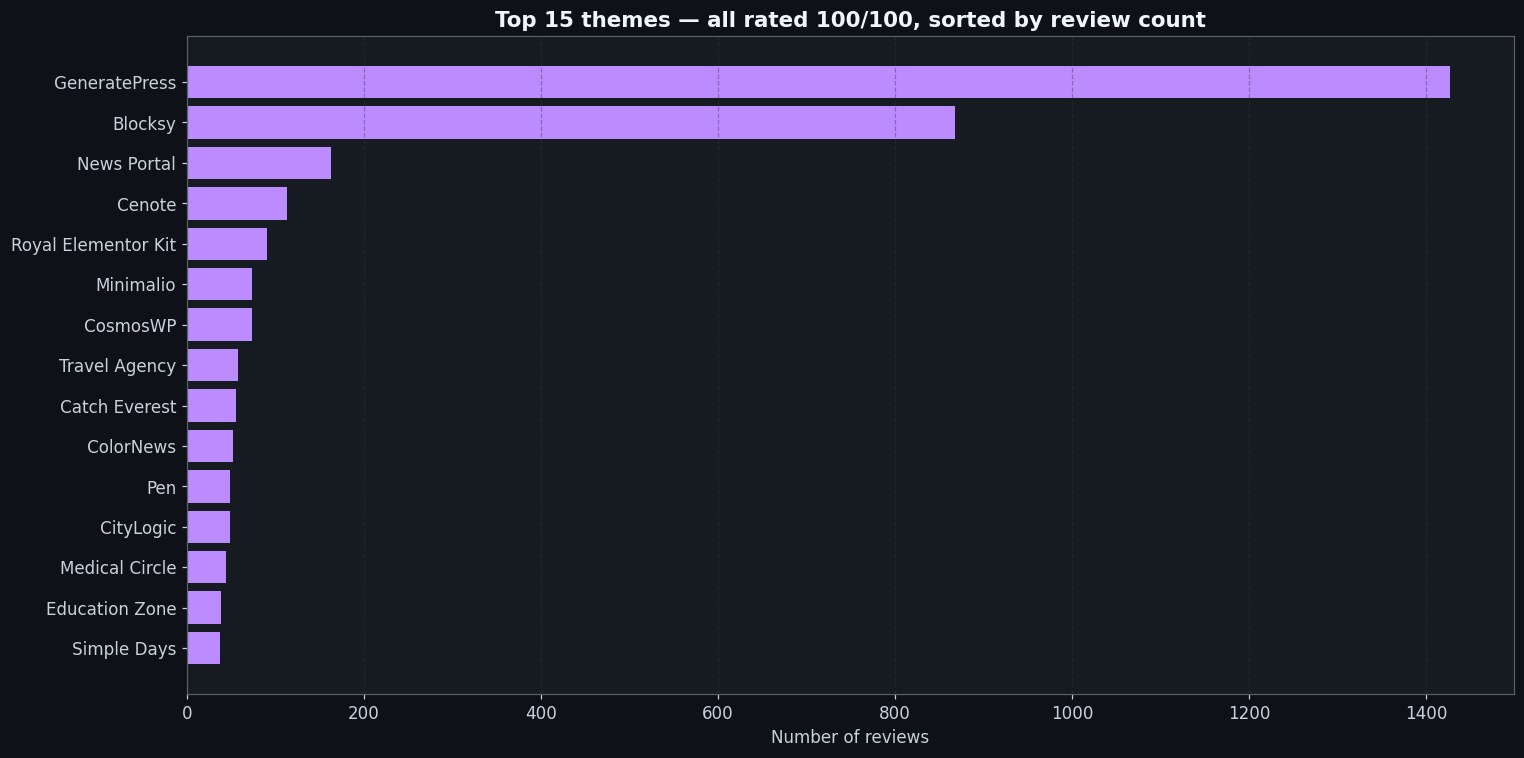
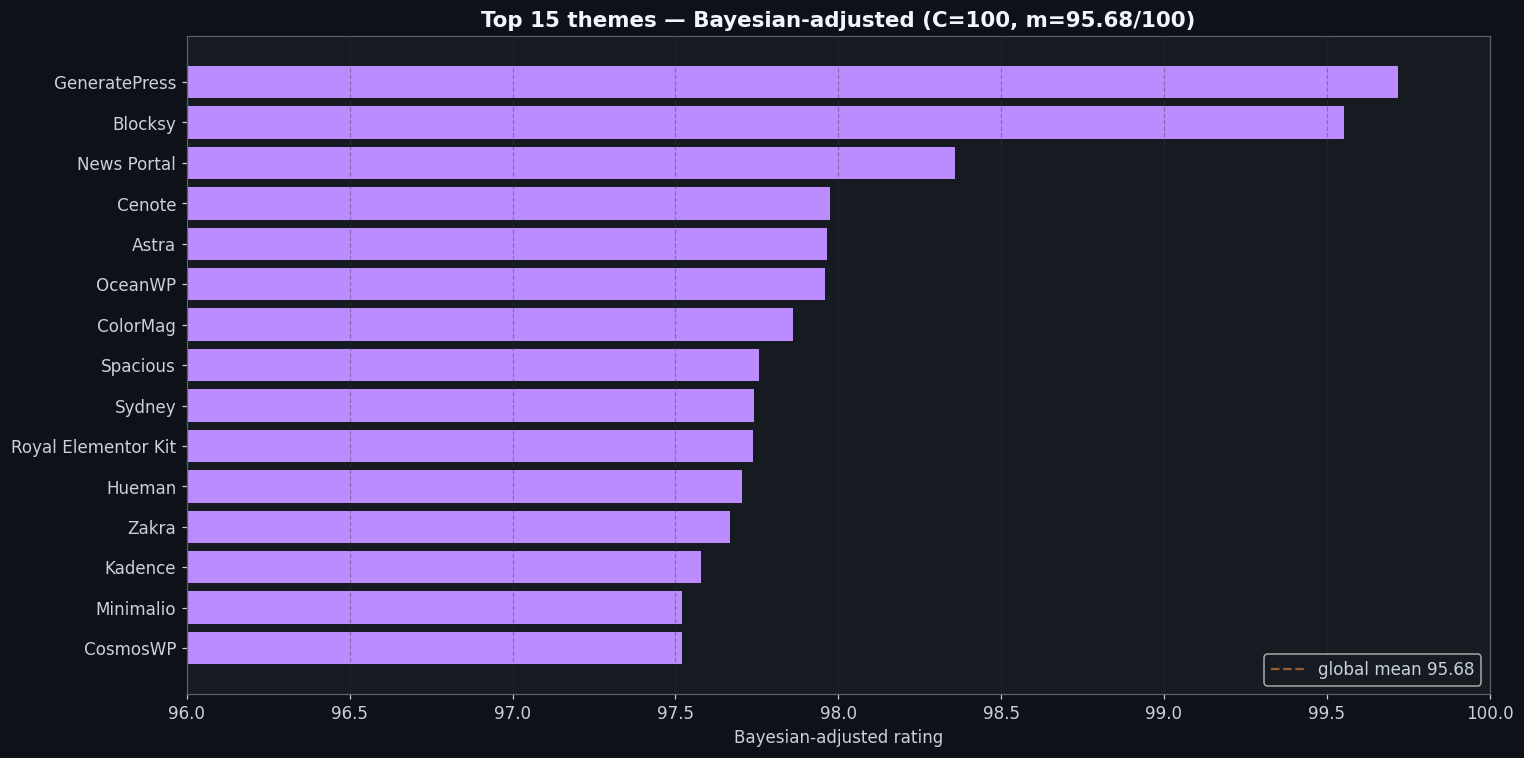
- 1,342 themes share a perfect 100/100 rating. On raw score alone, more than a thousand themes are tied for first place. The Bayesian-adjusted ranking (using C=100, which means 100 reviews earns you half your own score) sorts the genuinely-earned 100s from the single-digit-review outliers. GeneratePress tops the adjusted ranking with 1,427 reviews and an adjusted score of 99.72. Blocksy is second with 867 reviews at 99.55. A theme sitting at 100/100 with 3 reviews is not meaningfully the same as GeneratePress, but the raw rating field treats them identically, which is why the adjusted ranking exists and why looking only at raw ratings tells you almost nothing about the theme tier.
- 1.15% of WordPress installs still run WP 4.9, that’s more than any single 5.x release. WP 4.9 was released in November 2017. It is currently not just outdated but skipped-over: every 5.x release individually holds less than 1.15% of the install base. WP 5.0 introduced Gutenberg. The cluster of sites still on 4.9 are almost certainly sites that were deliberately frozen before the block editor arrived and have not been touched since. They’re not being updated. They’re not being migrated. They’re running. This is the fossilized edge of the long tail with an IP address and a hosting contract. WordPress core still ships security patches for 4.9. The question is whether anyone applies them.
- The
woocommerceauthor account ships 30 plugins averaging 55/100. Automattic’s own auxiliary WooCommerce plugins, WooPayments, WooCommerce Services, the legacy REST API, are the weakest-rated software at significant install volume on the platform. Thewoocommerceauthor account averages 55/100 across its 30 plugins. Independently-built WooCommerce extensions, the community add-ons that live in the same ecosystem, rate 96 to 100. This shows up in section 3 as well, but it bears repeating in a list of surprises because it violates the intuition that the company that built a platform should be best positioned to extend it. Mandatory integrations (payment processors, legacy API shims) attract users who have no alternative and leave reviews that reflect that lack of choice. The community, building optional quality-of-life tools, earns its ratings from users who actively sought something out.
Closing thoughts on the WordPress plugin statistics
The WordPress plugin statistics in this post sit alongside a conventional story: that WordPress is the great open developer commons, a platform anyone can extend, where a solo developer with a good idea can reach millions of sites, where no single company controls the stack. That story is not wrong. It’s just increasingly incomplete at the edges that matter.
The data keeps surfacing hidden monopolies in places nobody’s writing about. The shop tag is effectively a WooCommerce synonym, one extension family captures the install volume while the rest of the tag hosts thousands of plugins collectively invisible against it. The Taxonomy category runs at an HHI of 5,455, well past the threshold that signals monopolistic concentration in standard market-structure analysis. Advertising is concentrated around Google Site Kit at 46.9% of installs, with an HHI of 2,408. These aren’t exceptions. They’re the structure of the ecosystem at sufficient resolution. The “open developer commons” framing is true in spirit and increasingly inaccurate in fact, because commons without power laws only exist in textbooks.
The second thing the data keeps showing is a gap between what authors build for and what users actually run. Authors declare PHP 7.4 as their floor while the real-world modal PHP version is 8.2, a gap that may be deliberate (defensive floor-setting) or inherited (untouched legacy code), and the data doesn’t resolve which dominates. Authors largely ignore Gutenberg, 93% of the plugin catalog, eight years in. And the plugin-AI cohort arrived in 2024 with volume and enthusiasm and ratings that haven’t been tested over time yet. The author cohort, collectively, is one platform-generation behind its own user base, navigating a compatibility surface that has shifted underneath them.
Three questions worth tracking through 2026: Will the 2025 plugin-AI cohort survive twelve months at acceptable ratings, or will the initial enthusiasm curdle into the same pattern that killed fast-shipped plugins in prior cycles? Will WooCommerce-as-platform stay invisible infrastructure, the substrate that 6,166 tagging plugins build on top of without anyone calling it a platform, or will Automattic shift posture and start surfacing that dependency explicitly? And does the Gutenberg adoption curve ever inflect, or has the plugin ecosystem looked at eight years of data and made its choice?
My read: WordPress’s center of mass is doing fine. It’s just doing fine in a way that looks a lot less like an open developer commons and a lot more like a stratified marketplace with a few platforms-on-the-platform sitting at the top.
How these WordPress plugin statistics were built
The WordPress plugin statistics in this post start with the WordPress.org public API. Two primary endpoints, api.wordpress.org/plugins/info/1.2/ and themes/info/1.2/, expose paginated catalog data via query_plugins and query_themes actions. Crawling the full catalog required roughly 63,000 plugin detail fetches and 8,000 theme detail fetches, each pulling the full metadata JSON for a single slug. Requests ran parallelized with polite backoff to avoid hammering the endpoint: connection pools capped, sleep intervals inserted between bursts, retry logic for transient failures.
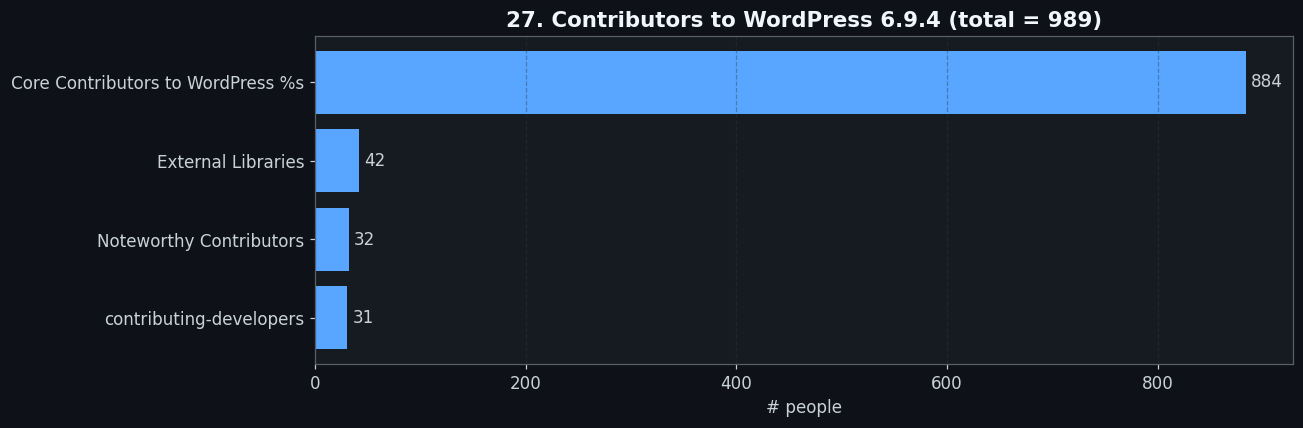
Platform-wide rates came from a second set of API endpoints: api.wordpress.org/stats/wordpress/1.0/, /stats/php/1.0/, /stats/mysql/1.0/, /stats/locale/1.0/, and /stats/themes/1.0/. These return the aggregate distributions used in §§7–8 and the platform-wide charts. Cross-reference for core version support and contributor data came from api.wordpress.org/core/version-check/1.7/ and api.wordpress.org/core/credits/1.1/.
Storage: the raw fetched detail JSON files were gzip-compressed per slug and stored under detail/<slug>.json.gz, totaling approximately 800 MB on disk. A distillation pass extracted the fields used in the analysis, installs, rating, version history, contributor list, tag set, PHP and WP version declarations, support thread counts, and readme metadata, into a slim ~10 MB _analytics_cache.jsonl.gz, one record per plugin, which is what all analysis scripts actually read.
Charts were generated with matplotlib on a dark theme at 1600×900 pixels. Three scripts cover the full chart set: make_charts.py for the main ranking and ecosystem charts, make_charts_part4.py for the deep-dive series, and make_core_charts.py for the platform-wide distribution charts. Every quantitative claim in the analysis was verified end-to-end: the number goes from source JSON into the slim cache, through the analysis script, into the chart and the markdown assertion, and back against the live API. Thirty-eight automated checks pass against the full dataset.
Every chart
Every chart from this WordPress plugin statistics analysis, for the curious. Each links to the full-size 1600×900 PNG. Captions reference the analysis section where the chart originates.
Rankings (WordPress plugin statistics)
Categories & concentration in the WordPress plugin statistics
Deep dives into the WordPress plugin statistics
Platform-wide WordPress plugin statistics
A note on data, views, and process
All data is from WordPress.org’s public APIs (
api.wordpress.org/plugins/info/1.2/,themes/info/1.2/, andstats/*). No scraping, no private data, no internal sources. Everything in this analysis can be independently reproduced by querying the same public APIs. The analytical takes in this post are my personal perspective, and the post was written with the assistance of AI. If you want to act on any of these findings, query the same APIs yourself, run the analysis, and form your own conclusions.